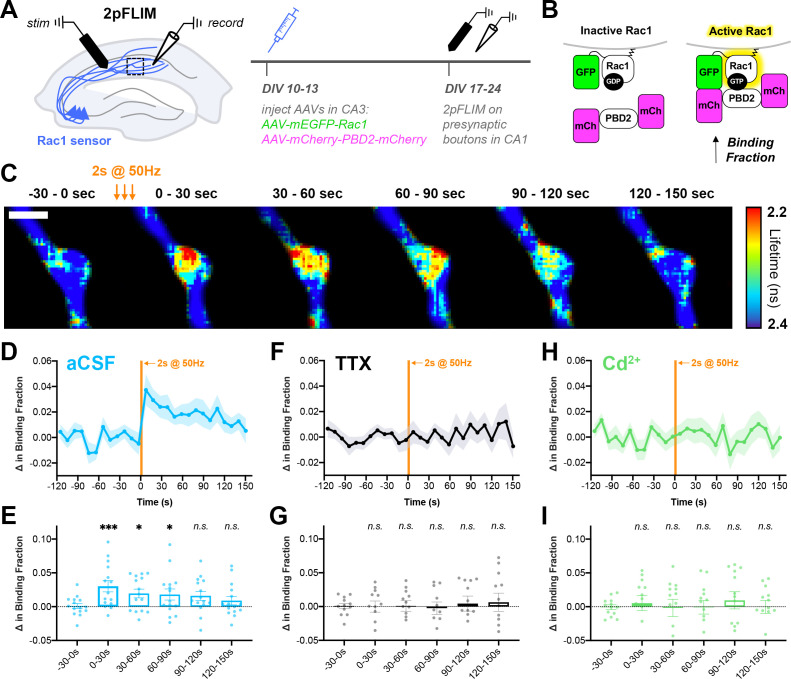
Figure 9. Action potential trains activate Rac1 in presynaptic terminals.
(A) Experimental design in organotypic hippocampal slices. (B) Schematic of Rac1 sensor. Activation of Rac1 leads to its association with the GTPase-binding domain of Pak2R71C,S78A (PBD2), increasing FRET between GFP and mCherry. This is measured as a decrease in fluorescence lifetime, or an increase in binding fraction. (C) Representative 2pFLIM images of a bouton before and after stimulation for 2 s at 50 Hz. Scale bar, 1 μm. (D) Mean time course of the change in binding fraction of the Rac1 sensor in aCSF (cyan, n=15 boutons/5 slices) with (E) quantification; one-way repeated measures ANOVA (F6,84=3.89, p=0.0018) with Dunnett’s multiple comparisons test vs the baseline (−30–0 s): 0–30 s (p=0.0005), 30–60 s (p=0.0102), 60–90 s (p=0.0142), 90–120 s (p=0.2881), 120–150 s (p=0.6807). (F) Mean time course of Rac1 sensor in TTX (black, n=12/4) with (G) quantification; one-way repeated measures ANOVA (F6,66=0.8539, p=0.5334) with Dunnett’s multiple comparisons test vs the baseline (−30–0 s): 0–30 s (p=0.9930), 30–60 s (p=0.9839), 60–90 s (p=0.6430), 90–120 s (p=0.7654), 120–150 s (p=0.6548). (H) Mean time course of Rac1 sensor in Cd2+ (green, n=13/4) with (I) quantification; one-way repeated measures ANOVA (F6,72=0.2728, p=0.9479) with Dunnett’s multiple comparisons test vs the baseline (−30–0 s): 0–30 s (p>0.9999), 30–60 s (p=0.9996), 60–90 s (p=0.9996), 90–120 s (p=0.9997), 120–150 s (p=0.8896). All data are mean ± SEM. *p<0.05, ***p<0.001, n.s. not significant.


