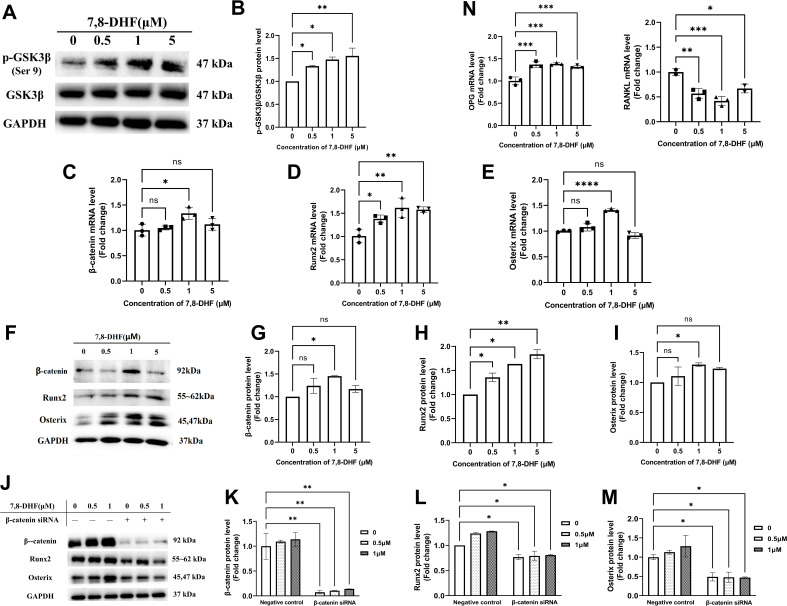
Figure 2. 7,8-Dihydroxyflavone (7,8-DHF) promoted osteogenesis via osteoblast-related signaling pathways.
MC3T3-E1 cells were treated with or without 7,8-DHF for 3 days. The mRNA level was evaluated by quantitative real-time PCR (qRT-PCR) and the protein level was detected by western blot. GAPDH was used as an internal control. (A) The protein levels of p-GSK3β and GSK3β. (B) Quantification of the p-GSK3β band intensities normalized to total GSK3β band intensities in each case. (C-E) The mRNA levels of β-catenin, Runx2, and Osterix. (F-I) The protein levels of β-catenin, Runx2, and Osterix. The expression levels of target proteins in the 0 μM group were normalized to 1. (J-K) β-Catenin knockdown by siRNA was performed in MC3T3-E1 cells with or without 7,8-DHF treatment. The protein levels of β-catenin, Runx2, and Osterix. The expression levels of target proteins in the 0 μM of negative control group were normalized to 1. Representative images from three independent experiments are shown in (A, F, J). Source files of the full raw unedited blots and blots with the relevant bands labeled were provided in Figure 2—source data 1. (N) The mRNA levels of osteoprotegerin (OPG) and receptor activator of nuclear factor-κB ligand (RANKL). All results were expressed as mean ± SD (A-N: n = 3; *p < 0.05, **p < 0.01, ***p < 0.001, ****p < 0.0001, ns: not significant; A-I, N: one-way analysis of variance [ANOVA]; J-M: two-way ANOVA).


