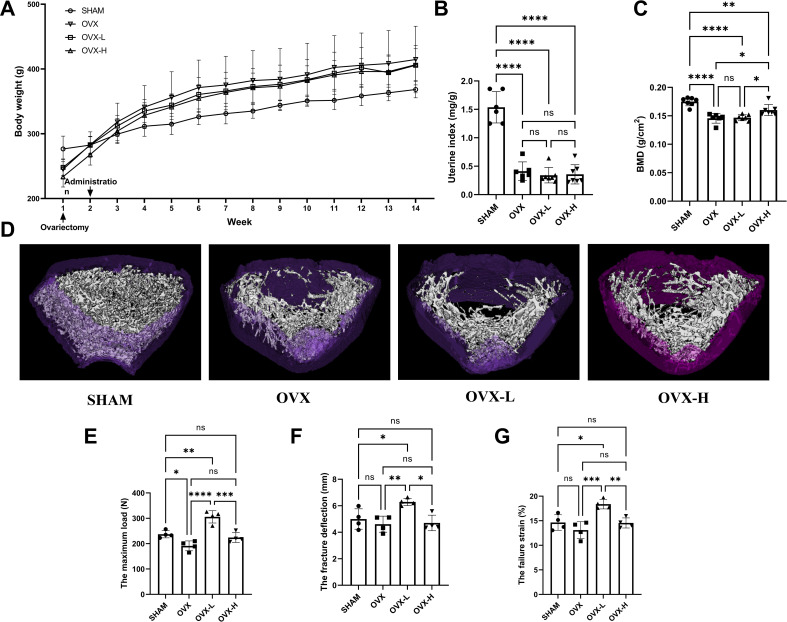
Figure 5. 7,8-Dihydroxyflavone (7,8-DHF) alleviated osteoporosis phenotypes and enhanced mechanical properties in ovariectomy (OVX) rats.
(A) The body weights of all rats were recorded weekly during the experimental period. Source file of the weight record was available in Figure 5—source data 1. (B) Uteruses were isolated and weighed after euthanized. The uterine index was represented as uterus weight divided by body weight. Results were expressed as mean ± SD. (C) The bone mineral density (BMD) in left femur of rats by dual-energy X-ray absorptiometry (DXA). Results were expressed as mean ± SD (A-C: n = 6–7, *p < 0.05, **p < 0.01, ****p < 0.0001, ns: not significant, one-way analysis of variance [ANOVA]). (D) Representative micro-CT images from each group: three-dimensional (3D) architecture of trabecular bone within the distal metaphyseal femur region. Source files of the raw unedited images of proximal growth plate, trabecular structure, and cortical structure were available in Figure 5—source data 2. (E–G) Right femurs were isolated and subjected to a compression test for biomechanical property analysis. The maximum load (E), the fracture deflection (F) and the fracture strain (G) were evaluated for each group. Results were expressed as mean ± SD. All results were expressed as mean ± SD (n = 4, *p < 0.05, **p < 0.01, ***p < 0.001, ****p < 0.0001, ns: not significant, one-way ANOVA).

