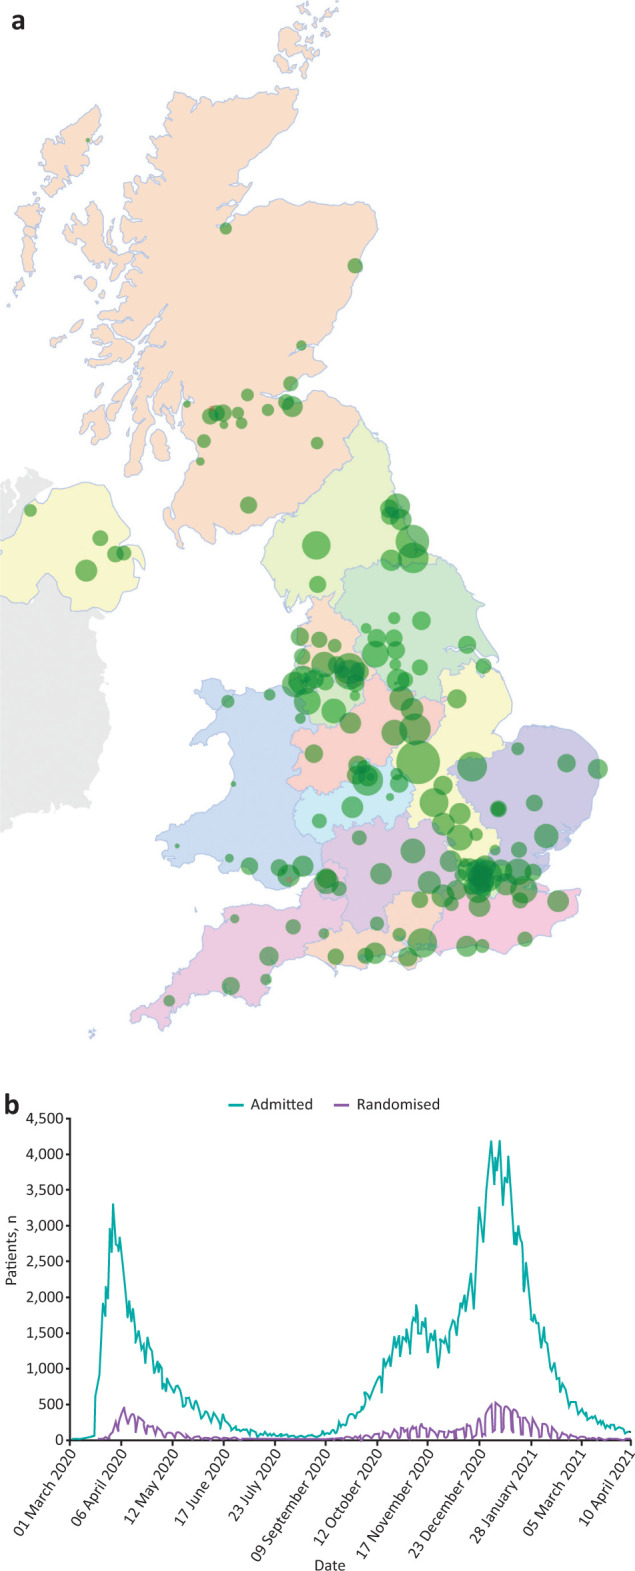
Fig 3.

a) Map of RECOVERY trial sites across the UK. Each green circle represents the location of an active study site with the size corresponding to the number of participants recruited. b) RECOVERY recruitment timeline with daily COVID-19 hospitalisations in Great Britain (data from NHS).
