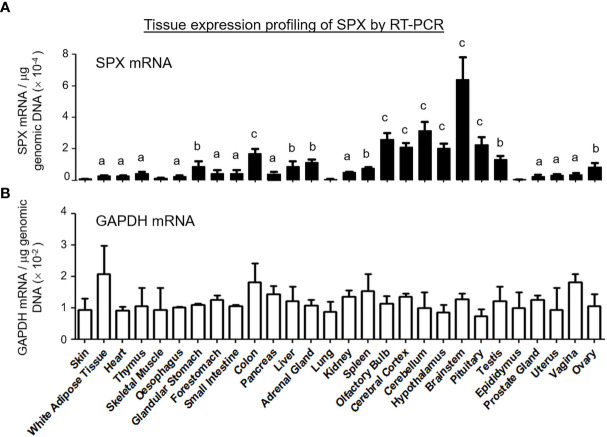
Figure 3.
Tissue distribution of SPX expression by RT-PCR. A total of 28 tissues were harvested from the mouse, reversely transcribed and subjected to real-time PCR with primers specific for mouse SPX. (A) The data for SPX transcript were normalized with genomic DNA obtained in the same sample during the process of RNA isolation to adjust for variations in the amount of tissue used in sample preparation. Parallel PCR for GAPDH with similar data normalization was also conducted to serve as the internal control. (B) The groups denoted with different letters (a, b, c) represent a significant difference (P < 0.05, Student’s t test, N = 5) in SPX gene expression compared to the skin (the tissue with the lowest level of SPX expression as a reference for comparison). In this study, GAPDH expression in tissues examined did not exhibit significant difference compared to the skin. (Grouping of SPX expression: No label, no difference vs the skin; (a) ≤ 5 fold higher than the skin; (b) between 5 to 10 fold higher than the skin; (c) ≥ 10 fold higher than the skin).

