
Figure 4.
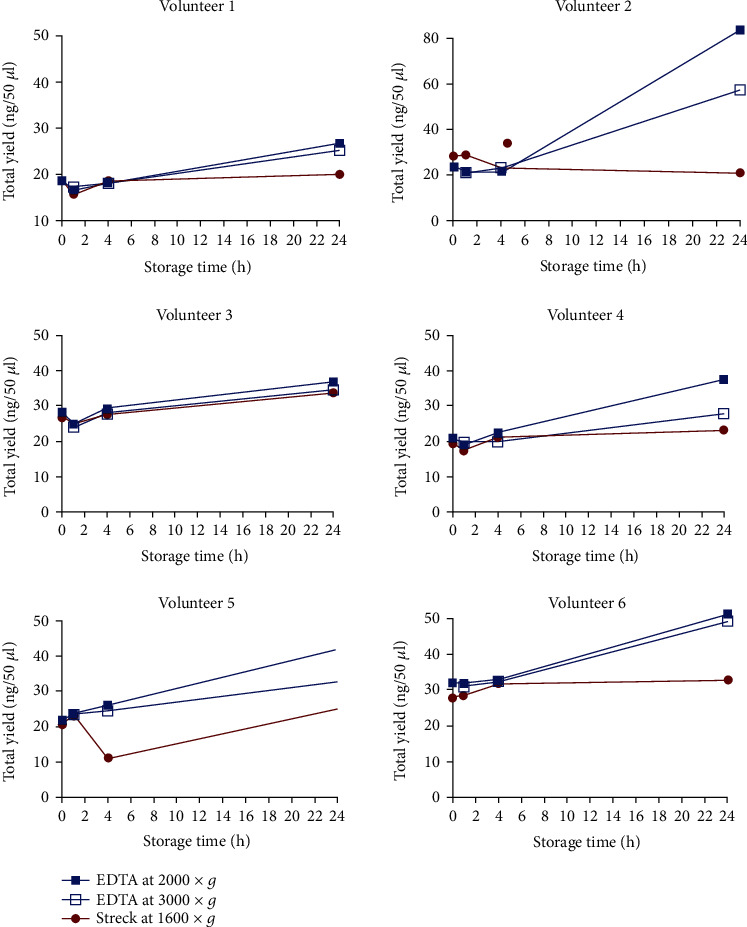
The yield of cfDNA in plasma samples from healthy volunteers drawn in EDTA BCTs and Streck BCTs where the plasma was separated and processed fresh (0 h) and within less than one hour (1 h), after four (4 h), and 24 h storage time. The value of each dot represents the concentration of cfDNA per 50 μl obtained from 1.5 ml plasma and the mean value from technical duplicates.