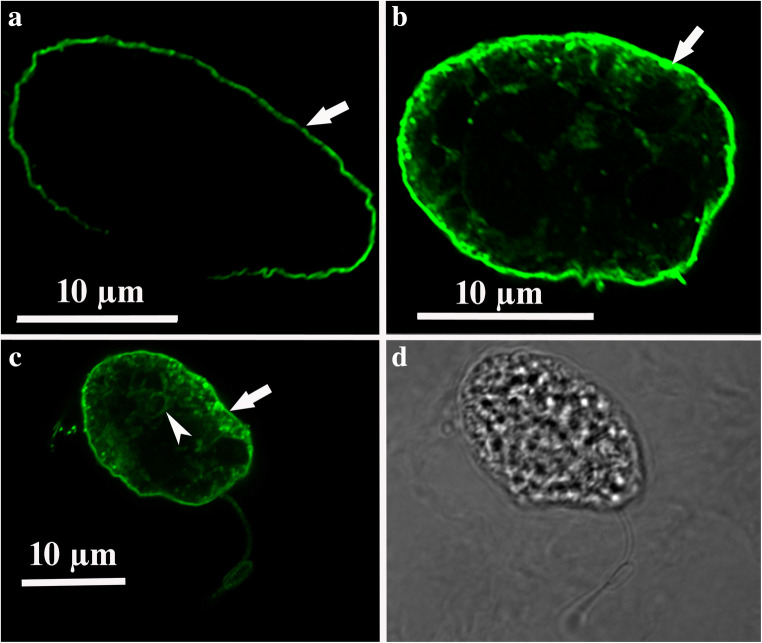
Fig. 8.
Photographs obtained by CLSM of Oxyrrhis marina cells. The binding of the antiserum to the cell periphery is shown in micrographs (a), (b), and (c) (marked with arrows). Note the fluorescence labeling of internal cell components of the cell shown in c (marked with an arrowhead), with the same cell shown in bright field in micrograph (d). For better display, the digitized pictures were adjusted for brightness and contrast. Scale bar are indicated in a, b, and c

