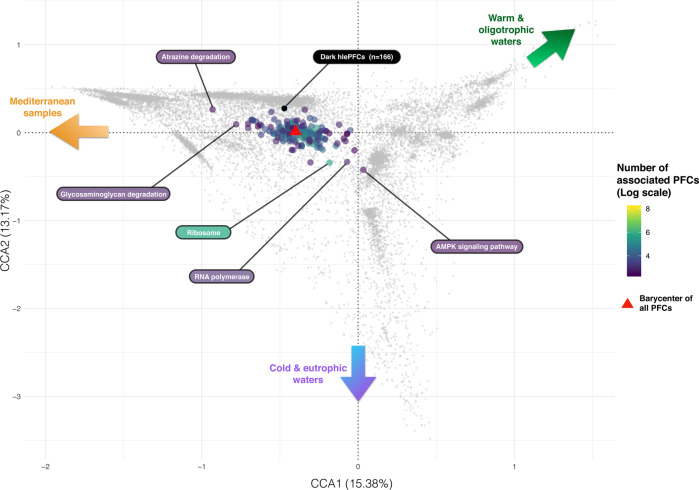
Fig. 3. Barycenters of metabolic pathways detected at least 10 times in the canonical correspondence analysis (CCA) space.
Gray dots represent hlePFCs in the same way as in Fig. 2, while colored points indicate the barycenters of KEGG metabolic pathways that occurred at least ten times among hlePFCs, the barycenter of a pathway corresponding to the barycenter of the positions of its associated hlePFCs. The color of each barycenter codes for the number of PFCs annotated to the focal pathway, in log scale. A red triangle indicates the barycenter of all hlePFCs in the CCA space. The barycenter of dark hlePFCs (i.e., hlePFCs without functional annotation and the taxonomical assignment below the phylum level) was represented in black Colored arrows indicate the environmental conditions associated with the different zones of the CCA space (see Fig. 2).

