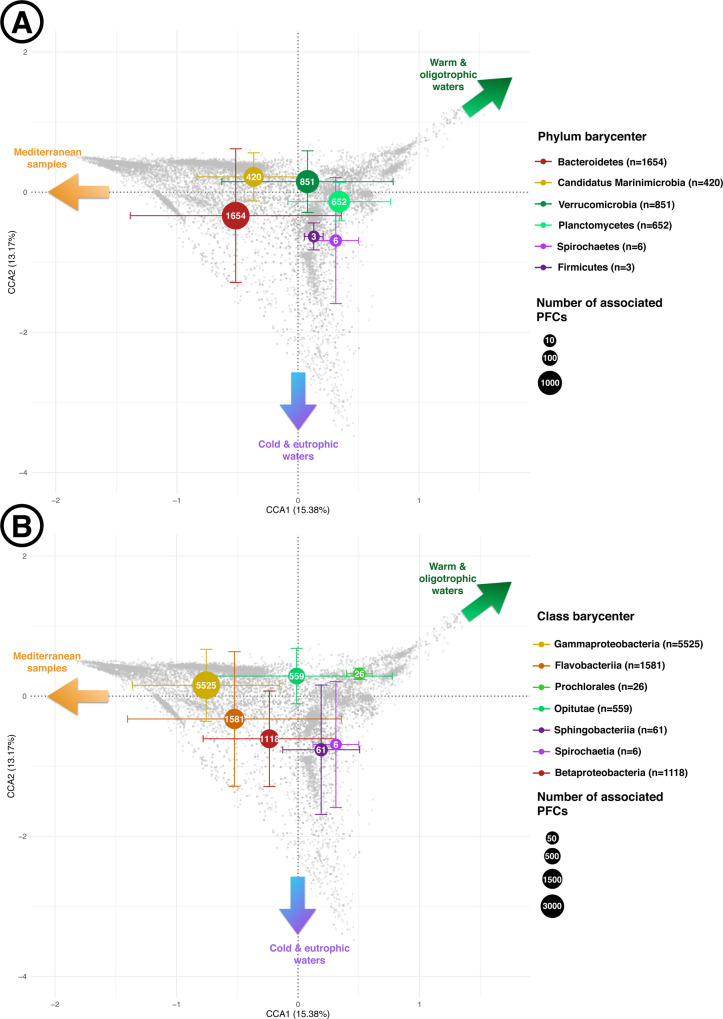
Fig. 4. Distribution in the canonical correspondence analysis (CCA) space of the barycenters of protein functional clusters highly linked to the environment (hlePFCs) associated with particular taxa.
A Six selected phylum and (B) seven selected classes. These taxa were selected because they had the most peripheral barycenters’ positions in the CCA space. Error bars correspond to the standard deviations of hlePFCs positions around their barycenters on CCA1 and CCA2 axes for each taxon. The size of barycenters represents the number of associated hlePFCs for each taxon, with the exact corresponding values written in white in each barycenter and in the legend. Colored arrows indicate the environmental conditions associated with the different zones of the CCA space (cf. Fig. 2).

