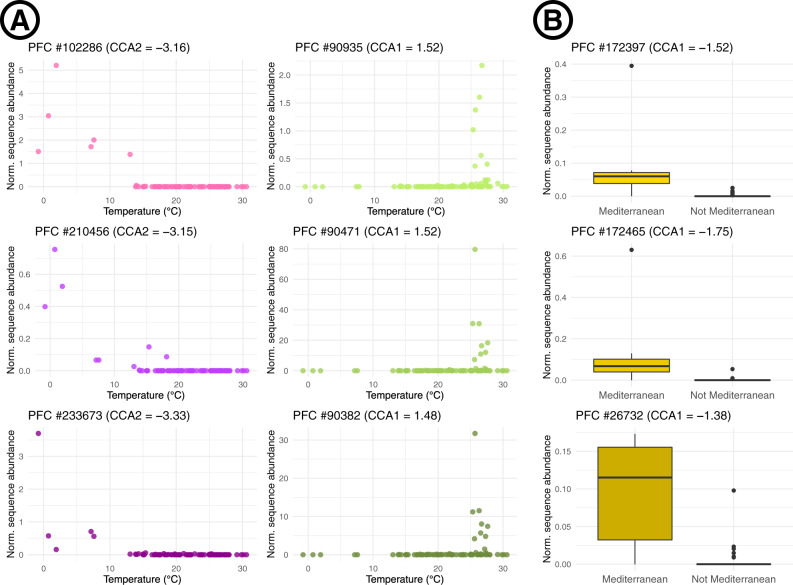
Fig. 5. Detecting functionally unannotated protein functional clusters highly linked to environmental conditions.
A Relationships between normalized sequence abundance and temperature for six selected protein functional clusters highly linked to the environment (hlePFCs) that were only composed of functionally unannotated sequences. The three graphs on the left, in purple, correspond to the three hlePFCs functionally unannotated in both KEGG and eggNOG databases that had the lowest positions along the second axis of the canonical correspondence analysis (CCA2) (cold and nutrient-rich waters). The three graphs in the middle, in green, correspond to the three hlePFCs functionally unannotated in both KEGG and eggNOG databases that had the highest positions along CCA1 (oligotrophic and warm waters). B Relationships between normalized sequence abundance and location of sampling, whether in the Mediterranean Sea or not, for 3 dark hlePFCs (only functionally unannotated sequences and no taxonomic annotations under the phylum level). These 3 hlePFCs had the lowest positions among dark PFCs on the first axis of the canonical correspondence analysis (CCA2) (correlated to Mediterranean samples). Each boxplot summarizes the abundance values of its focal PFC in Mediterranean samples (n = 6) and non-Mediterranean samples (n = 87). Boxplots minima and maxima correspond to −1.5 and 1.5 times the interquartile range, while the limits of boxes correspond to the first and third quartiles. The centerline indicates the median. All points outside of the minima-maxima range are plotted.

