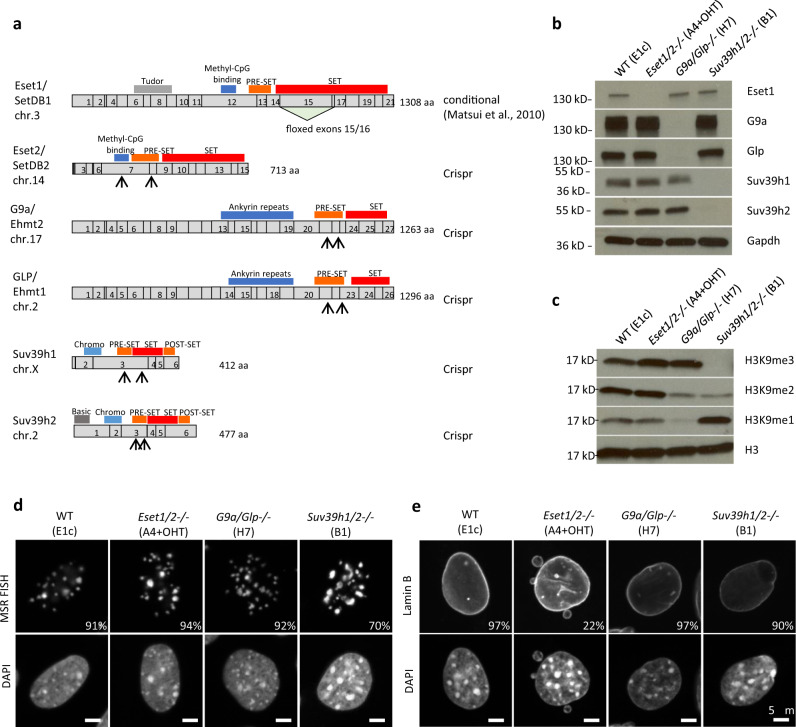
Fig. 1. Three distinct gene pairs encode H3K9 KMT enzymes in the mouse genome.
a Domain structure of the six SET-domain H3K9 KMT. For each gene, numbered boxes indicate exons, and conserved protein domains are indicated above the gene structure. The triangle below Eset1 illustrates the floxed exons deleted upon tamoxifen treatment. For the other SET-domain H3K9 KMT genes, disruptions were generated by CRISPR/Cas9 technology, with the location of the gRNAs indicated by arrows below the gene structure. b Gene pair mutants lacking either Eset1/Eset2, G9a/Glp, or Suv39h1/Suv39h2. Western blots were performed on whole-cell extracts of the mutant clones (top) using specific antibodies indicated on the right. Gapdh was used as a loading control. Eset1 deletion was probed with extracts after 2 days of induction in culture with 4-hyroxytamoxifen (4-OHT, 1 μM) followed by 2 days in a normal medium. Representative results of two independent experiments. c Western blot analysis of H3K9 methylation states in H3K9 KMT gene pair mutants. Acid-extracted histones were probed with antibodies specific for H3K9me1, H3K9me2, and H3K9me3. Total H3 was used as a loading control. Representative results of three independent experiments. Source data are provided as a Source Data file. d DNA FISH for major satellite repeats (MSR) in control and H3K9 KMT gene pair mutants. Percentages indicate cells that display the shown pattern. N = 325 cells examined for WT, 329 for Eset1/2−/−, 301 for G9a/Glp−/−, and 384 for Suv39h1/2−/− over two independent experiments. For each image, lower panels show DAPI counterstaining of the same nuclei. e Immunofluorescence for Lamin B, marking the nuclear lamina. Percentages indicate cells that display the shown pattern. N = 402 cells examined for WT, 439 for Eset1/2−/−, 321 for G9a/Glp−/−, and 410 for Suv39h1/2−/− over two independent experiments. For each image, lower panels show DAPI counterstaining of the same nuclei. Scale bars represent 5 μm.

