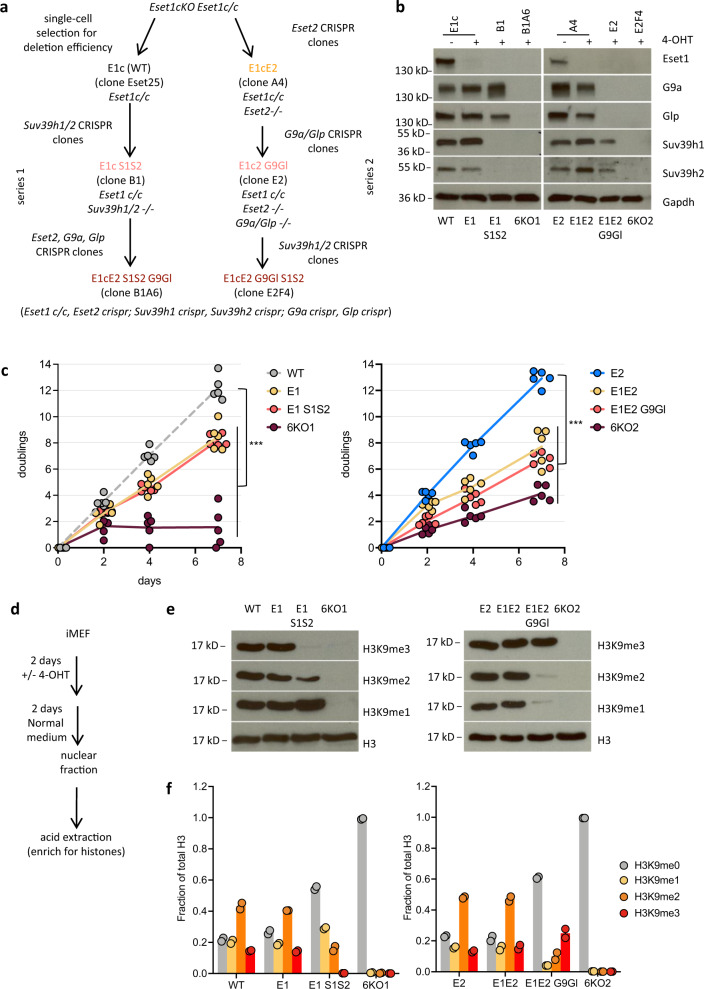
Fig. 2. Loss of H3K9 methylation in compound H3K9 KMT-mutant MEF cells.
a Generation of compound H3K9 KMT-mutant MEF by successive CRISPR/Cas9-mediated inactivation of genes encoding H3K9 KMT enzymes. Two series of H3K9 KMT mutants were generated. Nomenclature for the H3K9 KMT mutants is indicated on the scheme. E1c (Eset1-conditional, also WT), E1 (Eset1-null), E2 (Eset2-null), G9 (G9a-null), Gl (Glp-null,) S1 (Suv39h1-null), and S2 (Suv39h2-null). b Western blot analysis for H3K9 KMT gene products in whole-cell extracts of WT and H3K9 KMT mutants. Gapdh was used as a loading control. Representative results of two independent experiments. Source data are provided as a Source Data file. c Proliferation capacity of compound H3K9 KMT mutants. The y axis indicates cumulative doublings after consecutive days in culture (x axis). E1c/WT and E2 were grown in a normal medium, and all other H3K9 KMT mutants in presence of 1 μM 4-OHT in a culture medium (individual data points with line connecting their mean, N = 5 independent experiments). Statistically significant differences in doubling time, when compared to WT (left) or E2 (right) growth curves are shown by asterisks (***P = 1.1 × 10⁻¹⁰ for E1 and E1 S1S2, P = 7.2 × 10⁻¹¹ for 6KO1, P = 2.8 × 10⁻⁸ for E1E2, P = 2.6 × 10⁻⁸ for E1E2 G9Gl and 6KO2, extra-sum-of-squares F test). d Induction of Eset1 deletion. Cells were grown for 2 days in presence of 1 μM 4-OHT in culture medium, followed by 2 days in normal medium without 4-OHT. After cell lysis and fractionation, histones were acid-extracted from the nuclear fraction. e Western blot analysis of H3K9 methylation states in compound H3K9 KMT mutants. Acid-extracted histones were probed with antibodies specific for H3K9me1, H3K9me2, and H3K9me3. Total H3 was used as a loading control. Representative results of three independent experiments. Source data are provided as a Source Data file. f Mass spectrometry analysis of H3K9 methylation states. The y axis indicates the fraction of total H3 carrying H3K9me1, H3K9me2, or H3K9me3 modifications, determined by normalizing intensities obtained for the corresponding peptides in nanoLC–MS (bars represent mean with individual data points overlaid, N = two independent samples).

