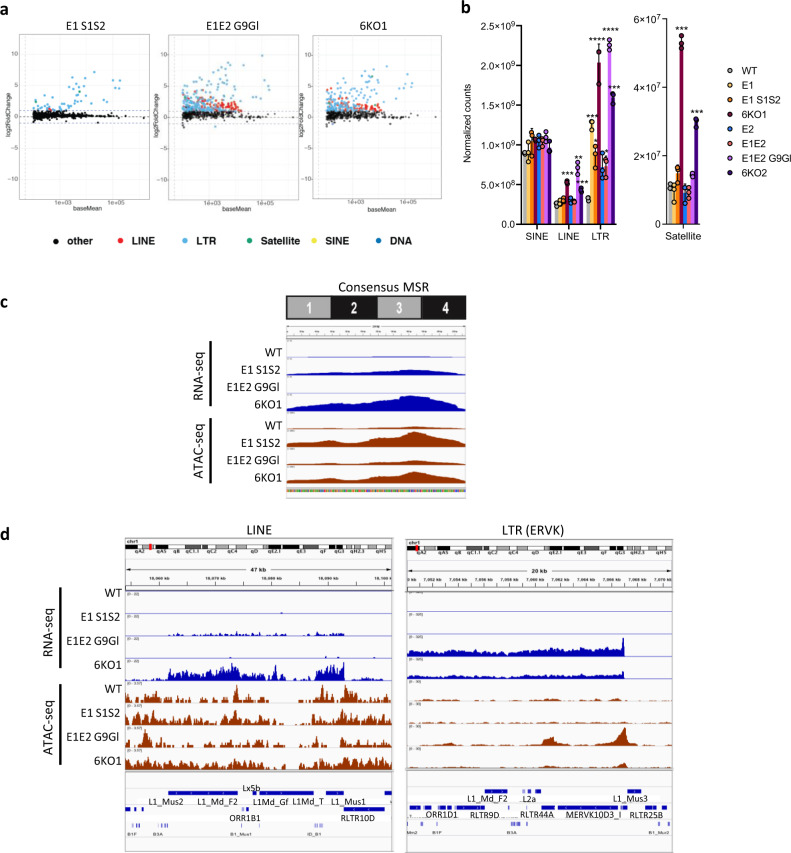
Fig. 3. Massive derepression of repeat elements in compound H3K9 KMT-mutant MEF cells.
a MA plots depicting changes in repeat element expression in compound H3K9 KMT mutants relative to WT, as determined by RNA sequencing (RNA-seq). From left to right: E1 S1S2, E1E2 G9Gl, and 6KO1. Black dots represent repeat elements whose change in expression is not statistically significant. Red, LINE elements. Light blue, LTR retrotransposons. Green, Satellites. Yellow, SINE elements. Dark blue, DNA transposons. b Global changes in expression for distinct repeat classes (SINE, LINE, LTR, and Satellite), in each of the compound H3K9 KMT mutants. The y axis indicates normalized read counts (mean ± SD, individual data points overlaid, N = 3 independent samples). Satellites are shown on a separate graph due to their lower expression level. Asterisks indicate statistically significant differences when compared to WT levels (LINE: ***P = 1.1 × 10⁻⁴ for 6KO1, **P = 0.006 for E1E2 G9Gl, ***P = 8.0 × 10⁻⁴ for 6KO2; LTR: ***P = 3.7 × 10⁻⁴ for E1, *P = 0.019 for E1 S1S2, ****P = 6 × 10⁻⁵ for 6KO1, *P = 0.026 for E1E2, ****P = 8.4 × 10⁻⁵ for E1E2 G9Gl, ***P = 3.6 ×10⁻⁴ for 6KO2; Satellite, ***P = 1.2 × 10⁻⁴ for 6KO1 and P = 1.4 × 10⁻⁴ for 6KO2, two-sided, unpaired t test). c Coverage plot of major satellite repeat (MSR) transcripts to the consensus MSR sequence in WT and H3K9 KMT mutants (from top to bottom: E1 S1S2, E1E2 G9Gl, and 6KO1). ATAC-seq indicating DNA accessibility in the same mutants is shown below. d Genome browser tracks showing expression levels (top) and ATAC-seq profiles (bottom) of example genomic regions with repeat elements. Left, genomic region harboring LINE elements. Right, region with LTR-containing elements (ERVK).

