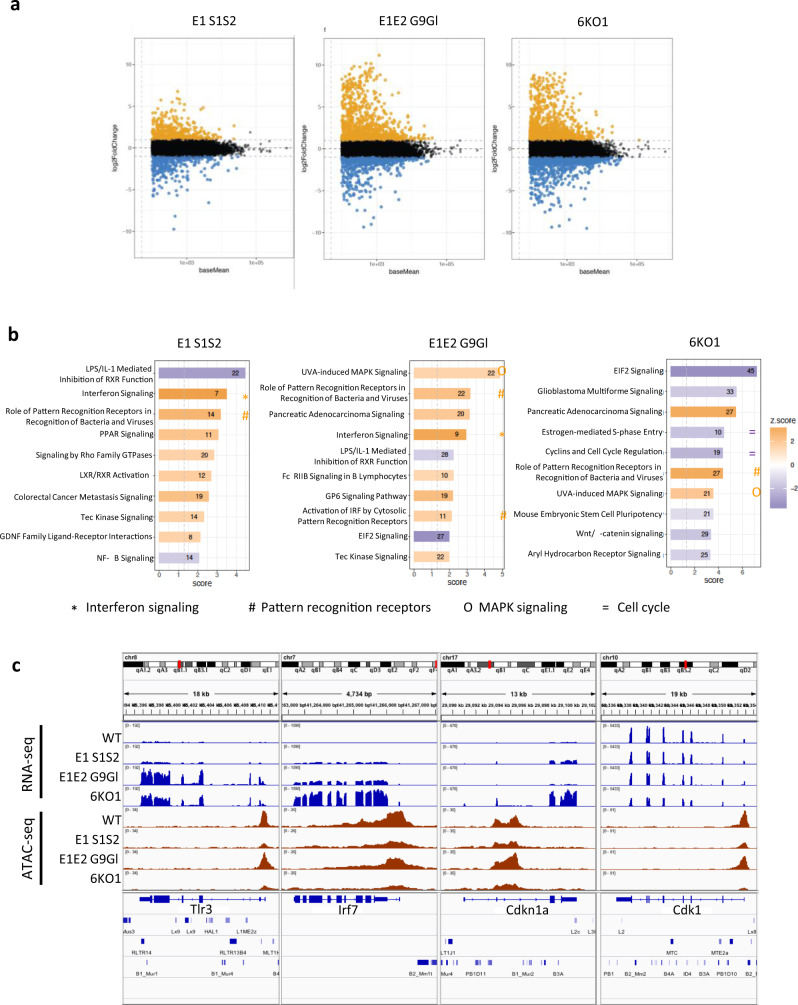
Fig. 4. Changes in gene expression in compound H3K9 KMT-mutant MEF cells.
a MA plots depicting changes in gene expression in compound H3K9 KMT mutants relative to WT, as determined by RNA sequencing (RNA-seq). From left to right: E1 S1S2, E1E2 G9Gl, and 6KO1. Black dots represent genes whose changes in expression are not statistically significant. Yellow dots represent upregulated genes, and blue dots downregulated genes. b Ingenuity pathway analysis (IPA) of genes differentially expressed in compound H3K9 KMT mutants relative to WT. From left to right: E1 S1S2, E1E2 G9Gl, and 6KO1. The x axis indicates fold change, and the color code indicate the z score for each category (legend on the right). Orange indicates upregulation, and purple downregulation of the pathway. Pathways related to pattern-recognition receptors, interferon signaling, MAP kinase signaling, or cell cycle regulation are highlighted by symbols as indicated below the table. c Genome browser tracks showing RNA expression levels (top) or ATAC accessibility (bottom) of example genes in compound H3K9 KMT mutants. From left to right, Toll-like receptor 3 (Tlr3), interferon regulatory factor 7 (Irf7), cyclin-dependent kinase inhibitor 1 A (Cdkn1a), and cyclin-dependent kinase 1 (Cdk1). For both RNA-seq and ATAC-seq tracks, the top profile corresponds to WT, followed from top to bottom by E1 S1S2, E1E2 G9Gl, and 6KO1 mutants.

