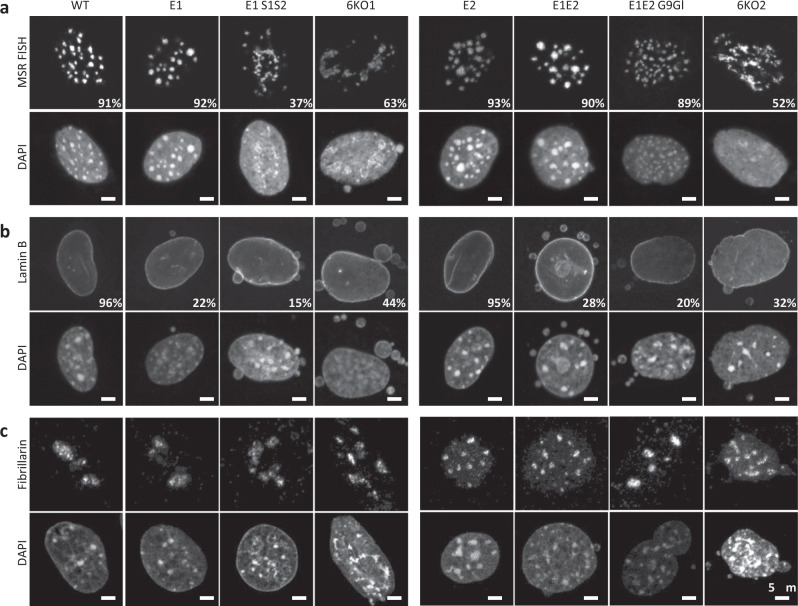
Fig. 6. Collapse of heterochromatin in compound H3K9 KMT-mutant MEF cells.
a DNA FISH for major satellite repeats (MSR) in control and compound H3K9 KMT mutant. Percentages indicate cells that display the shown pattern. N = 501 cells examined for WT, 303 for E1, 352 for E1 S1S2, 304 for 6KO1, 308 for E2, 311 for E1E2, 301 for E1E2 G9Gl, and 309 for 6KO2 over three independent experiments. For each image, lower panels show DAPI counterstaining of the same nuclei. b Immunofluorescence for Lamin B, marking the nuclear lamina. Percentages indicate cells that display the shown pattern. N = 680 cells examined for WT, 785 for E1, 302 for E1 S1S2, 305 for 6KO1, 573 for E2, 499 for E1E2, 558 for E1E2 G9Gl, and 427 for 6KO2 over three independent experiments. For each image, lower panels show DAPI counterstaining of the same nuclei. c Immunofluorescence for Fibrillarin, marking nucleoli. Representative images (N = 100 cells) are shown. For each image, lower panels show DAPI counterstaining of the same nuclei. Scale bars represent 5 μm.

