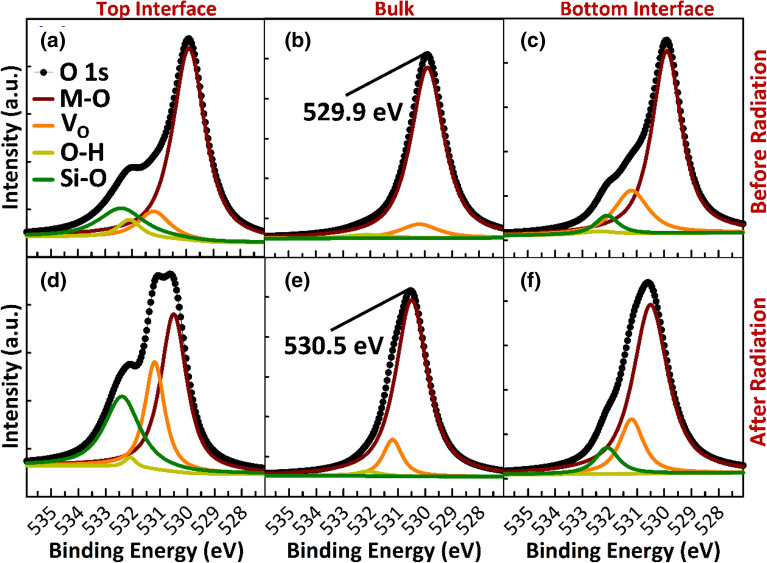
Figure 4.
XPS results showing O 1 s spectra of thin-film stacks (glass/SiO2/a-IGZO/SiO2) before (a–c) and after (d–f) deep UV light exposure at the top surface (a and d), in the bulk (b and e), and at the bottom surface (c and f) of the a-IGZO film. The O 1 s spectrum is deconvoluted into four energy peaks: M–O, VO, O–H, and Si–O. Peak O–M, which is centered at 529.9 eV, is attributed to O2− ions binding with In, Ga, and Zn atoms—and thus represents the quantity of the oxygen atoms in a fully oxidized stoichiometric environment. The VO peak at 531.2 eV stems from the deficiently bonded oxygen in the a-IGZO layer containing nonstoichiometric oxide species, such as In2O3−x, Ga2O3−x, and ZnO1−x, which are associated with VO. Peak O–H is related to metal–OH (hydroxyl) bonds and centered at 532.1 eV, while Peak Si–O is related to Si–O bonds and centered at 532.4 eV.

