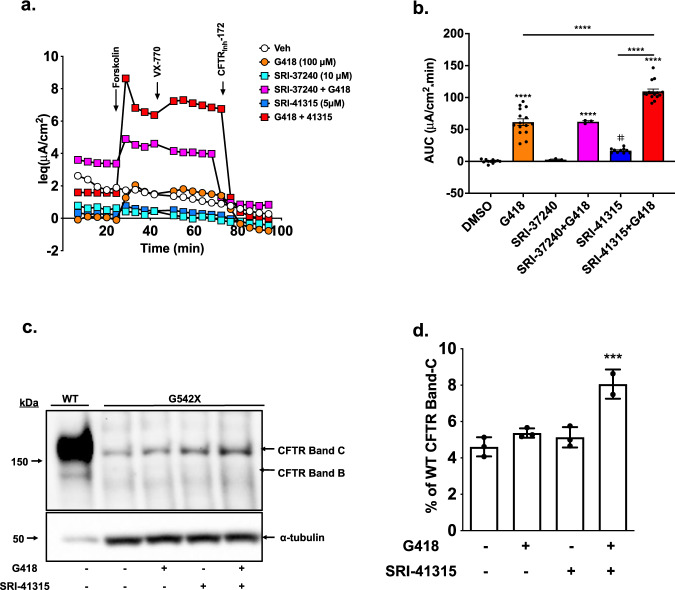
Fig. 5. Combining G418 with SRI-41315 enhanced CFTR expression and function in CFTR-G542X 16HBEge cells.
CFTR-G542X 16HBEge cells were treated with SRI-37240 (10 µM) or SRI-41315 (5 µM) alone and in combination with G418 (100 µM) for 72 h. CFTR-specific channel activity in treated cells was compared to a vehicle control (DMSO) in a liquid–liquid interface. a Representative equivalent current (Ieq) tracings for SRI-37240 and SRI-41315 treatments alone and in combination with G418 vs. the DMSO control. b Corresponding summary data calculated as area under curve (AUC) between forskolin-induced (10 µM) stimulation of CFTR activity and inhibition of CFTR with CFTRinh-172 (20 µM) (n = 3–15, data are expressed as mean ± S.D. and statistically analyzed using ordinary one-way ANOVA followed by Tukey’s post hoc test, #p = 0.0541 (Vehicle vs SRI-37240), ****p < 0.0001). c Representative western blot showing the levels of full-length CFTR band C (fully processed) and B (unprocessed) after combination treatment compared to single-agent treatments. The total protein loaded was 3 µg for wild-type samples and 10 µg for G542X samples. d Quantitation of CFTR western blotting data (normalized to tubulin) (n = 3, data are expressed as mean ± S.D. and statistically analyzed using ordinary one-way ANOVA followed by Tukey’s post -hoc test, ***p = 0.0008). Each experiment was performed 4–5 times with n = 3–4 monolayers per condition on each repeat. Source data is available as a source data file.

