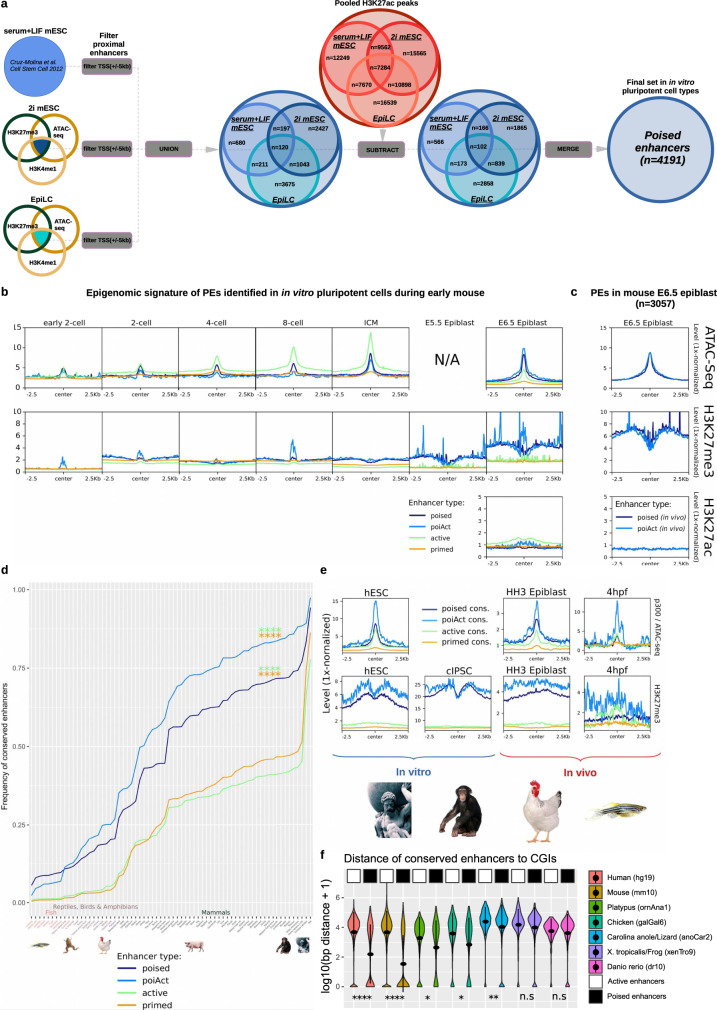
Fig. 1. Mouse poised enhancers (PEs) display their characteristic chromatin signature in vivo and are highly conserved in mammals.
a ATAC-seq and ChIP-seq data for p300, H3K4me1, H3K27me3, and H3K27ac were used to call PEs in three distinct in vitro pluripotent states (i.e. 2i ESC, S + L ESC and EpiLC)5,94. PEs are characterized by high p300/ATAC signals, high H3K27me3, and H3K4me1 levels, as well as low H3K27ac levels and located at least 5 kb apart from a TSS (“Methods”). b ATAC-seq, H3K27ac, and H3K27me3 signals during early mouse embryogenesis12–14 (2-cell stage to E6.5 epiblast) are shown around poised, active, primed and PoiAct enhancers identified in in vitro pluripotent cells. c Public available H3K27me314, as well as generated ATAC-seq and H3K27ac signals during early mouse embryogenesis (E6.5 epiblast) are shown around poised and PoiAct enhancers identified in in vivo. d Sequence conservation across 68 vertebrate species (Supplementary Data 1) was measured for poised, active, primed, and PoiAct enhancers using a mappability threshold of 0.5. PEs and PoiAct enhancers show significantly higher conservation than active (FC = 1.86, p = 2.98e−06; FC = 2.2, p = 5.25e−08 respectively; two-sided Wilcoxon test) or primed enhancers (FC = 1.72, p = 4.44e−06; FC = 2.03, p = 9.61e−08 respectively; two-sided Wilcoxon test). e ATAC-seq and H3K27me3 signals from human ESC (hESC), chimpanzee iPSC (cIPSC), epiblast from HH3 chicken embryos and 4 hpf zebrafish embryos are shown around poised, active, primed and PoiAct enhancers identified in mouse pluripotent cells and conserved in each of the corresponding vertebrate species. f Distance between active or poised mouse enhancers conserved in the indicated vertebrate species and CGIs identified in the same species using Bio-CAP6, 22. The asterisks indicate that PEs are significantly closer to CGIs than active enhancers in all species except the frog (two-sided Wilcoxon test). The exact overlap of PEs (compared to active enhancers) with CGIs increases in all these species: in human from 9.85% to 43.14% (p = 1.18e−276), in mouse from 10.88% to 58.91% (p < 2.2e−16), in platypus from 13.09% to 29.68% (p = 2.51e−06), in chicken from 9.93% to 25.95% (p = 1.37e−14), in lizard from 3.23% to 10.56% (p = 0.017), in Xenopus tropicalis from 3.90% to 8.72% (p = 0.94), and in zebrafish from 2.99% to 9.07% (p = 0.23). *p ≤ 0.05, **p ≤ 0.01, ***p ≤ 0.001, ****p ≤ 0.0001.

