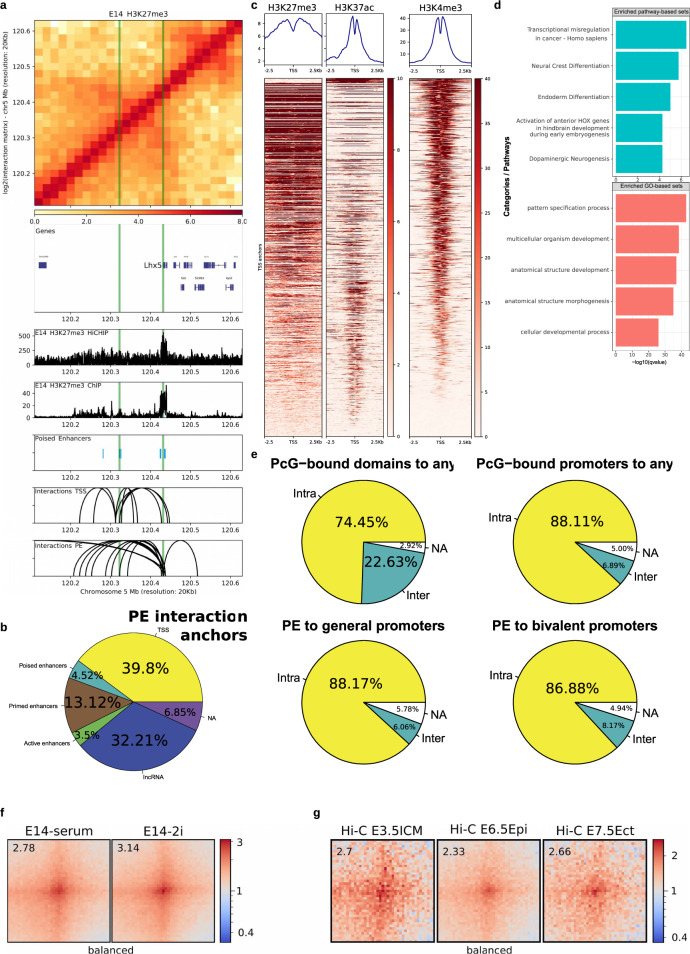
Fig. 3. Mouse PEs globally interact with bivalent promoters in pluripotent cells both in vitro and in vivo.
A H3K27me3 HiChIP and ChIP-seq profiles generated in mESC are shown around the Lhx5 locus. Both the Lhx5 TSS and a PE previously shown to control this gene in AntNPC (PE Lhx5 (−109kb)) are marked with green vertical lines. Upper panel: heatmap of log2 interaction intensities based on H3K27me3 HiChIP data generated in mESC. Two medium panels: ChIP-seq and 1D HiChIP signals for H3K27me3 in mESC. Lower two panels: significant (p < 0.01; FitHiChIP102) interactions were called using the H3K27me3 HiChIP PETs (paired-end tags) and loops in which one of the anchors overlaps (±10 kb) either the PE Lhx5 (−109kb) or the Lhx5 TSS are shown. b Significant (p < 0.01; FitHiChIP) interactions were called using the mESC H3K27me3 HiChIP PETs (paired-end tags). Interaction anchors were overlapped with PEs and their interaction partners were hierarchically annotated with the categories shown in the pie chart (“Methods”). c mESC ChIP-seq profiles for H3K27me3, H3K27ac, and H3K4me3 are shown around the TSS (n = 1083) interacting with PEs according to the H3K27me3 HiChIP loops identified in mESC (p < 0.01; FitHiChIP). d Pathway (green) and Gene Ontology (red) analysis for the TSS/genes interacting with PEs according to the H3K27me3 HiChIP loops identified in mESC (p < 0.01; FitHiChIP) was performed with ConsensusPathDB. e The interactions (called using mESC H3K27me3 HiChIP data; p < 0.01; FitHiChIP) established by PcG domains (“Methods”) and PcG-bound promoters as well as those involving PE-general promoter or PE-bivalent promoter pairs were classified as either intra-TAD (yellow) or inter-TAD (green) depending on whether the two anchors of each loop occur within the same or different TADs, respectively. f, g) Significant (mESC H3K27me3 HiChIP data; p < 0.01; FitHiChIP) interactions between distal PEs (>10 kb from TSS) and bivalent promoters (n = 526) were visualized as pileup plots using Hi-C data generated in vitro36 (2i ESC, serum+LIF ESC; f) and in vivo37 (E3.5 Inner Cell Mass (ICM), E6.5 epiblast, E7.5 ectoderm; g). Hi-C pairwise interactions are shown 250 kb up- and downstream of each PE and bivalent promoter pair. Hi-C interaction matrices were KR-balanced (balanced). The numbers in the upper left corners correspond to “loopiness” values (center intensity normalized to the intensity in the corners).

