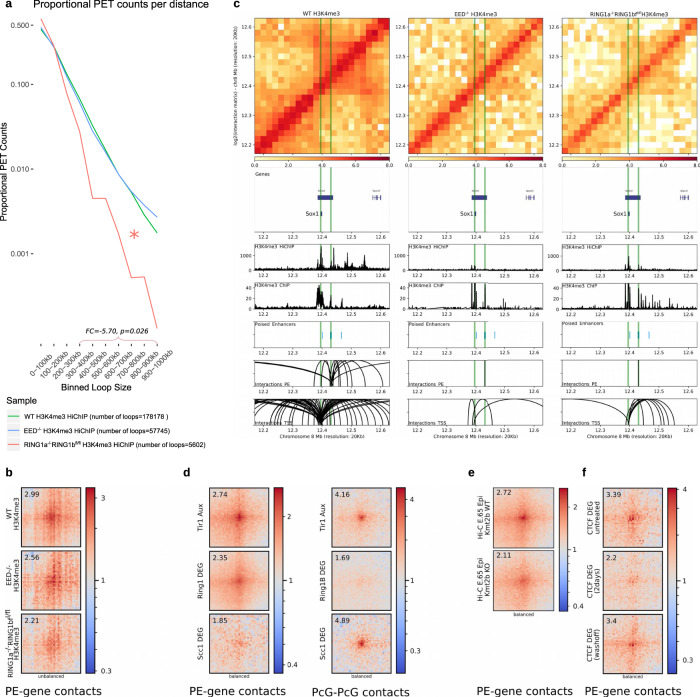
Fig. 4. Protein complexes controlling the interactions between PEs and bivalent promoters in mESC.
a Significant (q < 0.1; FitHiChIP) H3K4me3 HiChIP interactions identified in WT mESC, Eed−/− mESC and Tamoxifen-treated Ring1a−/−Ring1bfl/fl mESC were plotted according to their loop size. Mid-range (300kb-1mb) loops are significantly reduced (FC = −5.70, p = 0.026; two-sided Wilcoxon test) in Tamoxifen-treated Ring1a−/−Ring1bfl/fl mESC compared to WT. PET = paired-end tags. b Significant (mESC H3K27me3 HiChIP data; p < 0.01; FitHiChIP) interactions between distal PEs (>10 kb from TSS) and bivalent promoters (n = 526) were visualized as pileup plots using H3K4me3 HiChIP data generated in WT, Eed−/− and Tamoxifen-treated Ring1a−/−Ring1bfl/fl mESC. HiChIP interaction matrices were coverage-normalized (unbalanced). c H3K4me3 HiChIP in WT, Eed−/− mESC, and Tamoxifen-treated Ring1a−/−Ring1bfl/fl mESC around the Sox1 locus. d Significant (mESC H3K27me3 HiChIP data; p < 0.01; FitHiChIP) interactions between distal PEs (>10 kb from TSS) and bivalent promoters (left panel; n = 526) or between PcG domains (right panel; n = 411) were visualized as pileup plots using Hi-C data generated in the following mESC lines expressing Tir1 and treated with Auxin52: WT mESC (Tir1 Aux), Ring1a−/−Ring1bDEG/DEG mESC (i.e. RING1A/B-depleted cells; Ring1b Aux) and Rad21/Scc1DEG/DEG mESC (i.e. Cohesin depleted cells; Scc1 Aux). Hi-C interaction matrices were KR-balanced (balanced). e Significant (mESC H3K27me3 HiChIP data; p < 0.01; FitHiChIP) interactions between distal PEs (>10 kb from TSS) and bivalent promoters (n = 526) were visualized as pileup plots using Hi-C data generated in the epiblast from WT and Kmt2b/Mll2−/− E6.5 mouse embryos51. Hi-C interaction matrices were KR-balanced (balanced). f Significant (mESC H3K27me3 HiChIP data; p < 0.01; FitHiChIP) interactions between distal PEs (>10 kb from TSS) and bivalent promoters (n = 526) were visualized as pileup plots using Hi-C data generated in CTCF-Degron mESC lines53 that were either untreated (CTCF untreated), treated with Auxin for two days (CTCF Aux (2 days)) or treated with Auxin and then washed off (CTCF Aux (washoff)). Interaction matrices were KR-balanced (balanced). In (b, d–f), HiChIP or Hi-C pairwise interactions are shown 250 kb up- and downstream of each PE and bivalent promoter pair. The numbers in the upper left corners correspond to “loopiness” values (center intensity normalized to the intensity in the corners).

