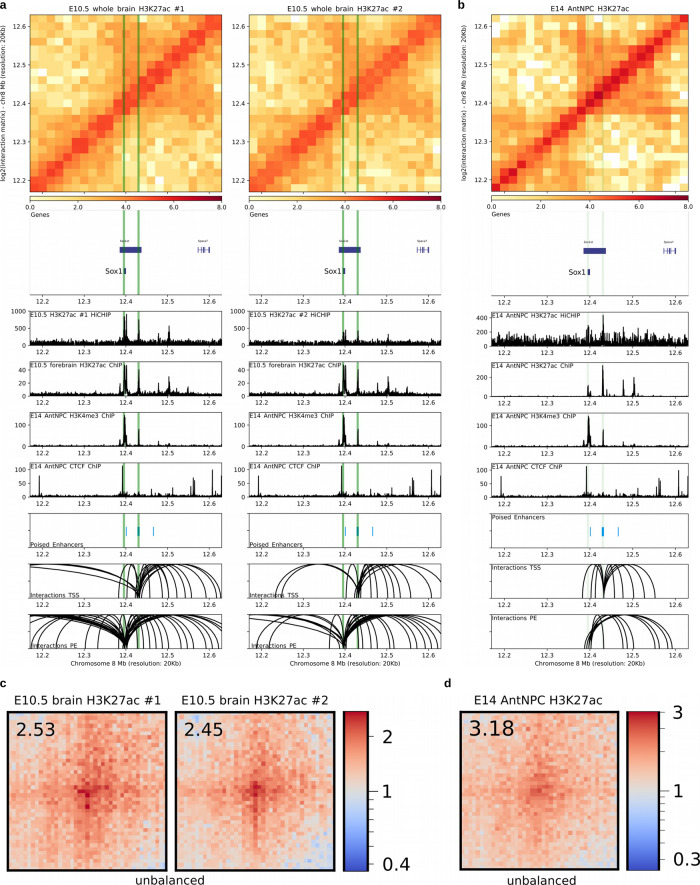
Fig. 5. Interactions between PEs and their target genes are maintained once PE becomes active in either AntNPC or the embryonic mouse brain.
a, b H3K27ac HiChIP and ChIP-seq profiles generated in E10.5 mouse brains (a; two biological replicates) and AntNPC (b; both replicates merged), respectively, are shown around the Sox1 locus. Both the Lhx5 TSS and the PE Sox1 (+35 kb) are marked with green vertical lines. Upper panel: heatmap of log2 interaction intensities based on H3K27ac HiChIP data generated in E10.5 mouse brain. Two medium panels: 1D HiChIP signals for H3K27ac in E10.5 mouse brain and H3K27ac, H3K4me3, and CTCF (for potential TAD boundaries) ChIP-seq profiles in AntNPC. Lower two panels: significant (p < 0.01 for E10.5 mouse brains; p < 0.05 for AntNPC; FitHiChIP) interactions were called using the H3K27ac HiChIP PETs (paired-end tags) and loops in which one of the anchors overlaps (±10kb) either the PE Sox1 (+35 kb) or the Lhx5 TSS are shown. c, d Significant (mESC H3K27me3 HiChIP data; p < 0.01; FitHiChIP) interactions between distal PEs (>10 kb from TSS) and ESC bivalent promoters (n = 526) were visualized as pileup plots using H3K27ac HiChIP data generated in H3K27ac HiChIP data generated in E10.5 mouse brain (c) or AntNPC (d). HiChIP interaction matrices were coverage-normalized (unbalanced). HiChIP pairwise interactions are shown 250 kb up- and downstream of each PE and bivalent promoter pair. The numbers in the upper left corners correspond to “loopiness” values (center intensity normalized to the intensity in the corners).

