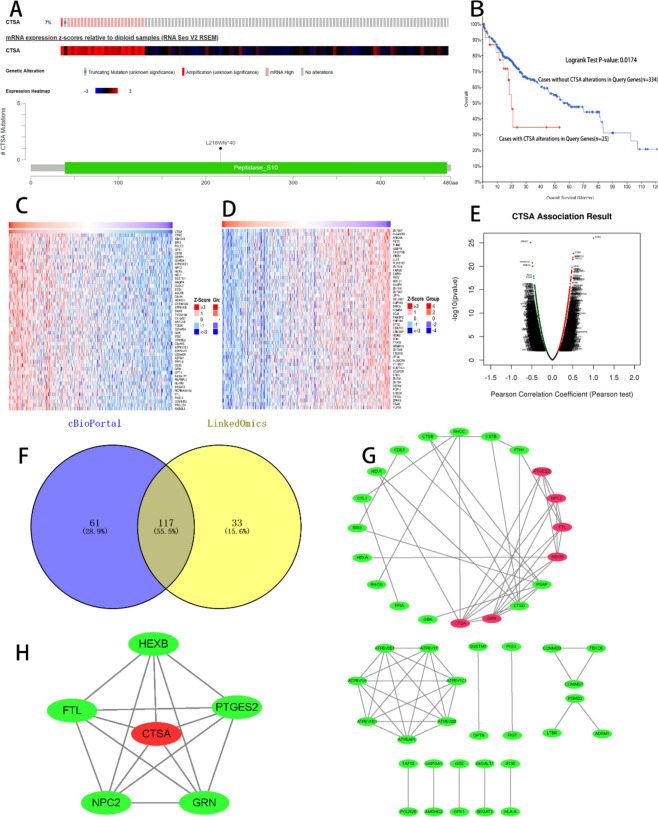
Figure 4.
Alteration analyzed in RNA-sequencing data and identification of CTSA co-expressed genes. (A) The alteration and Expression Heatmap of CTSA in a cohort of 359 HCC patients (TCGA, Firehose Legacy) from the cBioPortal database. 7% queried genes in this cohort exhibited alteration. One mutational hotspot, L218Wfs*40/frameshift deletion mutation was labeled. (B) the Kaplan–Meier curve shows that the OS percentage of HCC patients with CTSA alterations (n = 25) is poorer than without CTSA alterations. (C–E) CTSA correlated target genes analysis in the linkedomics database. (C) The top 50 genes that are positively correlated to CTSA. (D) The top 50 genes that are negatively correlated to CTSA. (E) Volcano chart display CTSA Positively/Negatively Correlated Significant Genes. (F) 117 overlapping genes with Spearman's Correlation greater than 0.35 obtained in the cBioportal database and the LinkedOmics database were screened as co-expressed genes of CTSA. (G) The 117 co-expressed genes of CTSA were used to construct the PPI networks with a confidence score of > 0.900 (highest confidence). (H) The PPI network showed that the FTL, GRN, NPC2, HEXB, and PTGES2 protein can interact with CTSA.

