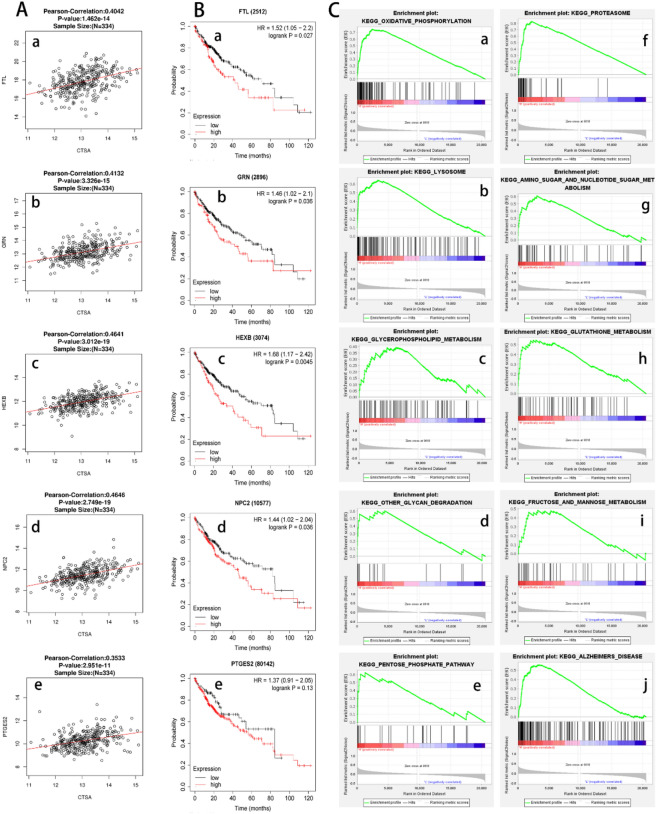
Figure 5.
(A) Correlation between CTSA and FTL (r = 0.4042), GRN (r = 0.4132), HEXB (0.4641), NPC2, (r = 0.4646), PTGES2 (r = 0.3533), all P < 0.05. (B) The Kaplan–Meier curve showed that the mRNA expression of FTL, GRN, NPC2, and HEXB were significantly related to the OS in HCC patients (all P < 0.05). (C) The main enriched KEGG pathways of CTSA. OXIDATIVE PHOSPHORYLATION, LYSOSOME, OTHER GLYCAN DEGRADATION, PENTOSE PHOSPHATE PATHWAY, PROTEASOME, AMINO SUGAR AND NUCLEOTIDE SUGAR METABOLISM, GLUTATHIONE METABOLISM, FRUCTOSE AND MANNOSE METABOLISM, ALZHEIMERS DISEASE, GLYCEROPHOSPHOLIPID METABOLISM.

