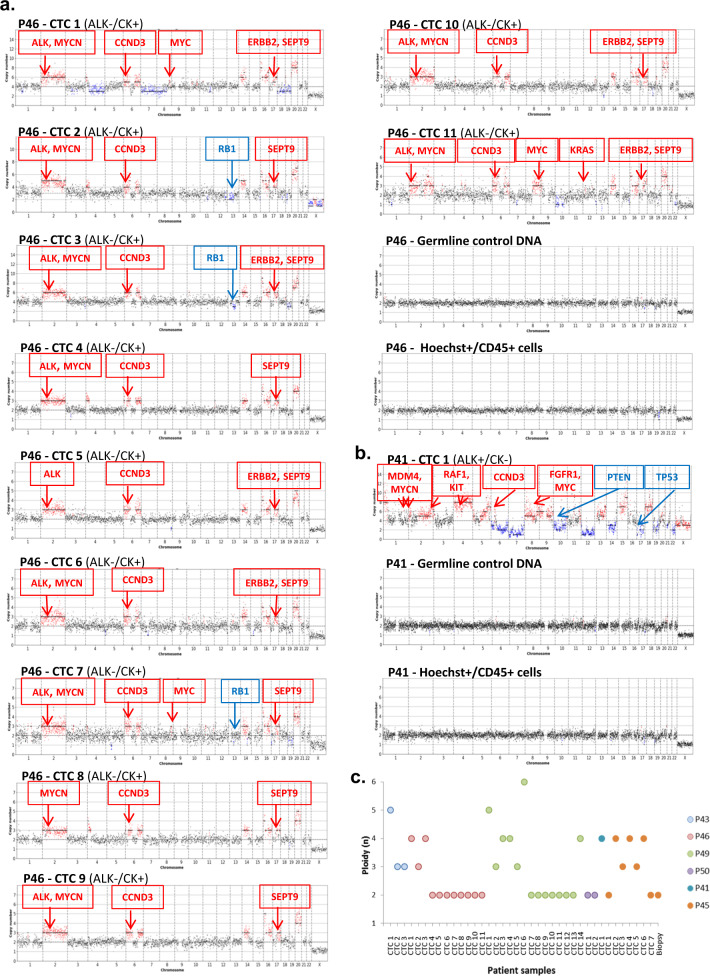
Fig. 2. Low-pass whole-genome CNA profiles and ploidy of CTCs.
CNAs in predominant pathways are annotated (gain in red, loss in blue). a CNA profiles of CTCs, corresponding leucocytes, and germline DNA from patient P46 resistant to crizotinib. b CNA profile of CTC, corresponding leucocytes, and germline DNA from patient P41 resistant to lorlatinib. c Ploidy determined for each CTC sample. P43 samples contain pools of 5 (CTC 1) or 10 (CTC 2, CTC 3) CTCs. CTC 1 of P46 is a pool of 2 CTCs. All other samples are single CTCs.

