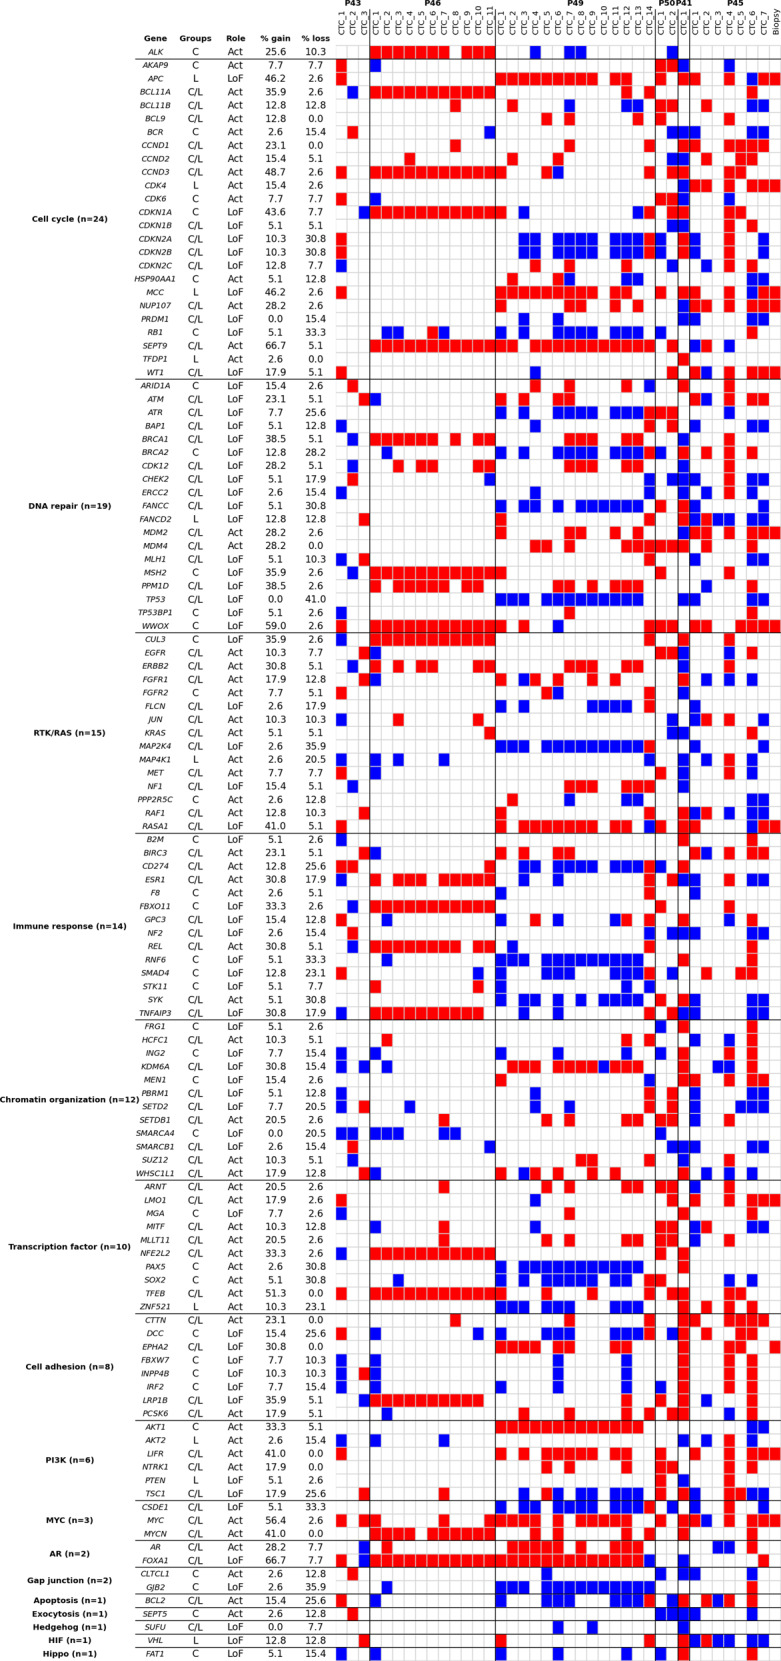
Fig. 4. Heatmap of CNA oncogenic drivers in CTC samples.

The altered genes are attributed to pathways. The pathways are sorted from the most to the least altered. The number of altered genes per pathway is shown in parentheses. CNA drivers present in patients at resistance to crizotinib only, in patients at resistance to lorlatinib only, and in both, are annotated “C”, “L” and “C/L” respectively in the “Groups” column. CNA driver function (activating or loss of function) is mentioned in the “Role” column. Frequencies of gain and loss in the 39 samples (38 CTC samples and 1 biopsy) are provided. Red and blue colors represent gains and loss respectively.
