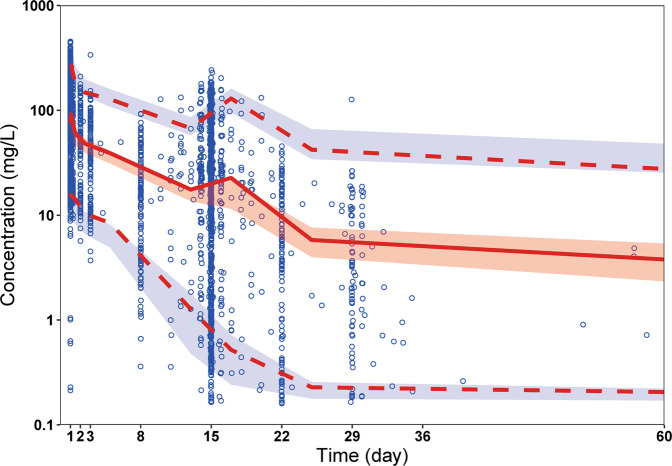
Fig. 3. Visual predictive check.
Circles represent observed data. Lines represent the 5% (dashed), 50% (solid), and 95% (dashed) percentiles of the observed data. Shaded areas represent nonparametric 95% confidence intervals about the 5% (light blue), 50% (light red), and 95% (light blue) percentiles of the predicted concentrations

