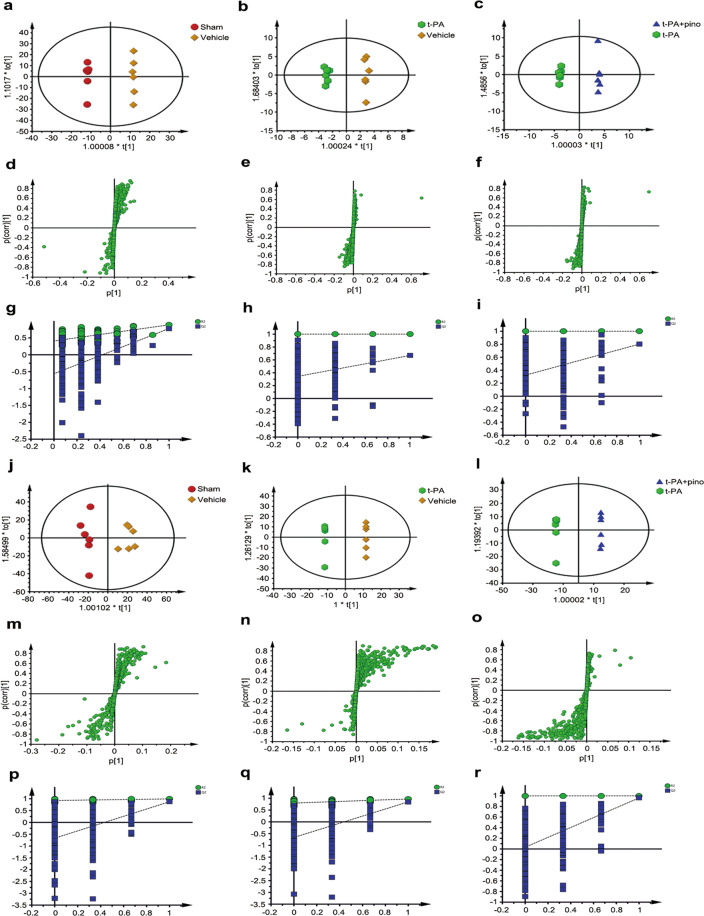
Fig. 6. OPLS score plot, corresponding S-plot, and PLS-DA corresponding validation plot derived from the cerebral cortex and serum.
a–i Cerebral cortex. j–r Serum. a, j OPLS score plot of the vehicle group vs sham group. b, k OPLS score plot of the t-PA group vs vehicle group. c, l OPLS score plot of the t-PA + pino group vs t-PA group. d, m Corresponding S-plot of the vehicle group vs sham group. e, n Corresponding S-plot of the t-PA group vs vehicle group. f, o Corresponding S-plot of the t-PA + pino group vs t-PA group. g, p Corresponding PLS-DA validation plot of the vehicle group vs sham group. h, q Corresponding PLS-DA validation plot of the t-PA group vs vehicle group. i, r Corresponding PLS-DA validation plot of the t-PA + pino group vs t-PA group.

