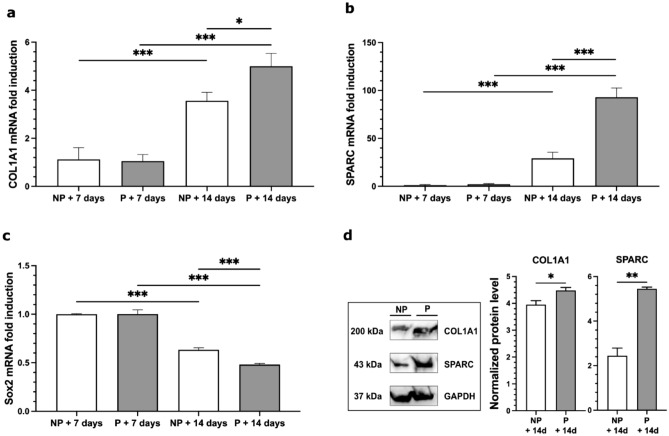
Figure 7.
(a–d) mRNA relative expression analysis of COL1A1, SPARC and Sox2 genes and WB assay of COL1A1 and SPARC proteins. (a–c) mRNA relative expression analysis (mean + SEM) of COL1A1, SPARC and Sox2. (a,b) mRNA relative expression analysis of the osteogenic differentiation genes COL1A1 (i.e. pro-alpha1 chains of type I collagen) and SPARC (i.e. secreted protein acidic and rich in cysteine) in non-pored (NP) and pored (P) scaffolds, 7 and 14 days after seeding. Expression levels of both genes are increased in the d14 scaffolds in comparison to the d7 ones. (c) Conversely, a progressive decrease of Sox2 mRNA level in non-pored (NP) and pored (P) scaffolds was detected at d7 and d14, confirming the differentiation of MSCs during this time window. Real-time PCR analysis was performed in triplicate (n = 6 pig per experimental group; statistics by two-way ANOVA and Bonferroni post hoc). Data are expressed as mean ± SEM. *p < 0.05; ***p < 0.001. (d) Immunoblot analysis and bar graphs showing the levels of COL1A1 and SPARC in non-pored (NP) and pored (P) scaffolds seeded with hBM-MSCs for 14 days. Cropped images are from samples run on the same gel. Pored scaffolds showed a significant increase in both COL1A1 and SPARC protein levels compared to the non-pored samples (n = 3; statistics using unpaired Student’s t test). GAPDH was used as loading control. Data are expressed as mean ± SEM. *p < 0.05; **p < 0.01. Positive and negative controls, as well as molecular size markers and full-length blots are presented in Supplementary Figure 2.

