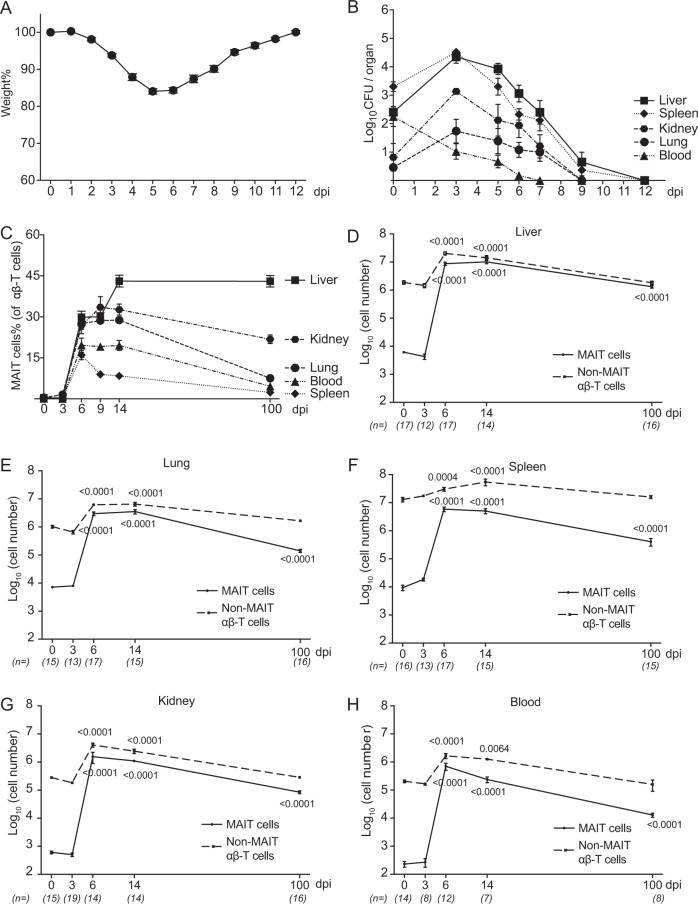
Fig. 2. Systemic and long-lasting expansion of MAIT cells in F. tularensis LVS infection.
A Body weight was recorded daily and calculated in percentage relative to starting weight of the individual mouse. Data are presented as mean ± SEM (n = 20 mice). B Bacterial load (CFU/organ or CFU/100 μl blood) from C57BL/6 mice at indicated time points post infection i.v. with 2 × 10⁴ CFU F. tularensis LVS. Data are presented as mean ± SEM. n = for day 0, 3, 5, 6, 7, 8, and 12: liver 4, 14, 8, 14, 8, 10, 6; spleen 4, 14, 8, 18, 6, 16, 6; kidney 4, 6, 8, 11, 11, 6, 6; lung 5, 14, 8, 20, 9, 16, 6; blood 4, 13, 8, 14, 8, 7, 6 individual mice. C–H Relative and absolute number of MAIT cells and non-MAIT αβ-T cells detected in various organs (as indicated) from naive and infected mice at indicated time points post infection. Pooled data from three independent experiments (mean ± SEM, n = 7–17 mice per group, as indicated). Statistical test: one-way ANOVA comparing each time point with 0 dpi, p-values are indicated. Source data are provided as a Source Data file.

