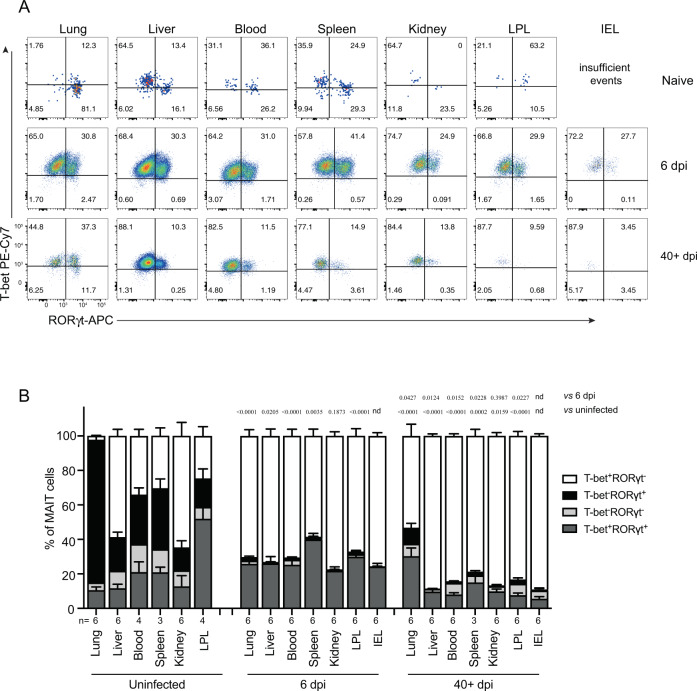
Fig. 4. MAIT cells were polarized to functional MAIT-1 phenotype upon F. tularensis infection.
A Representative flow cytometry plots showing intranuclear staining for T-bet (representing Th1) and RORγt (Th17) in gated MAIT cells from the liver, lungs, spleen, kidneys, LPL, IEL, and blood of naive and infected mice on 6 and 40+ dpi (41 and 68 dpi in two experiments) with 104 CFU F. tularensis LVS i.v. Numbers in quadrants represent cell percentage. It is noteworthy that IEL from naive mice yielded insufficient numbers of MAIT cells for accurate assessment of transcription factor expression and, thus, were omitted from our analysis. B Percentage of MAIT cells expressing combinations of T-bet and RORγt from the same mice in A. Pooled data from two independent experiments (mean ± SEM, n = 3–6 mice per group, as indicated). One-way ANOVA with Tukey’s multiple comparisons test was performed on MAIT-1% in each organ (except for IEL) between time points as indicated; p-values are indicated, nd; not determined. Source data are provided as a Source Data file.

