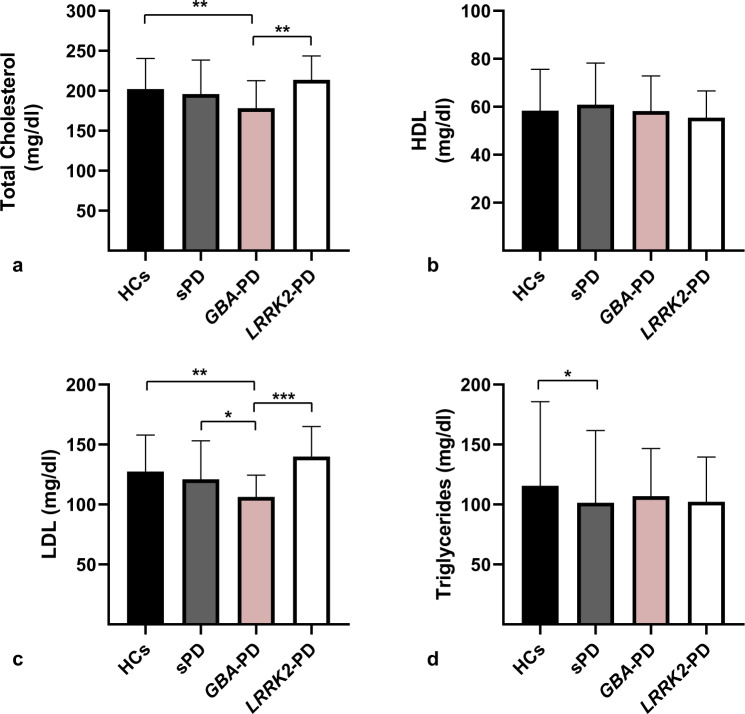
Fig. 1. Serum lipid profile among Parkinson’s disease cohorts and healthy controls.
Multiple comparisons of total cholesterol (a), HDL (b), LDL (c), and triglycerides (d) levels among healthy controls (HCs), sporadic Parkinson’s disease patients (sPD), GBA-associated Parkinson’s disease patients (GBA-PD), and LRRK2-associated Parkinson’s disease patients (LRRK2-PD). Numbers shown as means ± SD with one-way ANCOVA with post hoc testing for multiple comparisons as appropriate. ***p<0.005, **p<0.05, *p < 0.1.

