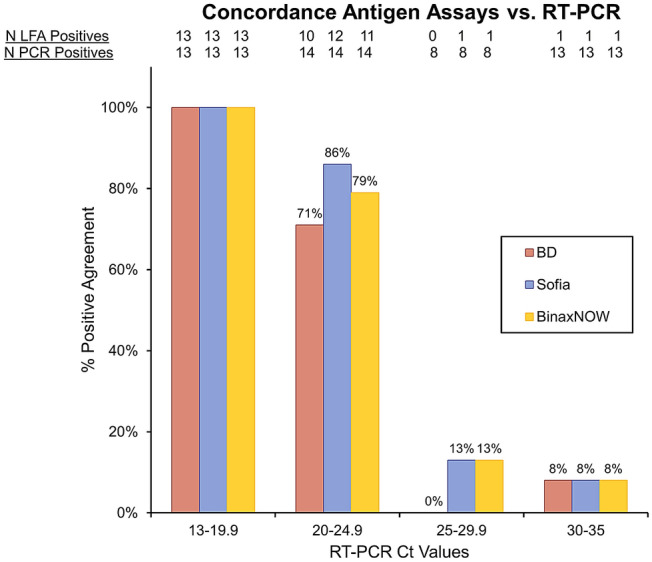
Figure 1.

Concordance of LFA and RT-PCR results. Qualitative results from the 3 LFA assays: BD, Sofia and BinaxNOW were compared to the RT-PCR results based on the Ct values. Ct values were divided in 4 groups and displayed on the x-axis. The total number of samples tested as positive by each LFA assay is displayed at the top of the graph, with the total number of samples tested underneath. Percent (%) positive agreement of each LFA assay to the RT-PCR assay is represented on the y-axis.
