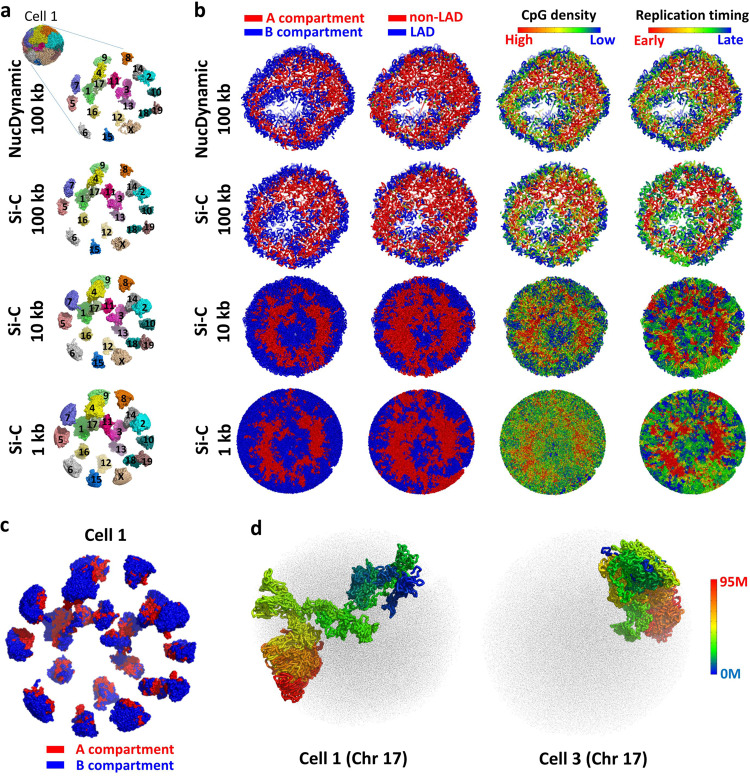
Fig. 4. Large-scale 3D structure of the genome.
a The Si-C calculated intact genome 3D structures of cell 1 at 100, 10, and 1 kb resolution with an expanded view of the separated chromosome territories along with the published NucDynamics 100-kb resolution structure of cell 1. The 100-kb resolution structures of NucDynamics are downloaded from GEO with accession code GSE80280. b Cross-sections of intact genome 3D structures of cell 1, colored according to whether the sequence is in the A (red) or B (blue) compartment (first column); whether the sequence is part of a lamina-associated domain (LAD) (blue) or not (red) (second column); the CpG density from red to blue (high to low) (third column); the replication time in the DNA duplication process from red to blue (early to late) (fourth column). c The Si-C calculated 10-kb resolution intact genome 3D structure of cell 1 with an expanded view of the spatial distribution of the A (red) and B (blue) compartments. d The Si-C calculated 10-kb resolution structures of chromosome 17 of cells 1 and 3 colored from red to blue (centromere to telomere) with structures of other chromosomes shown as black dots.

