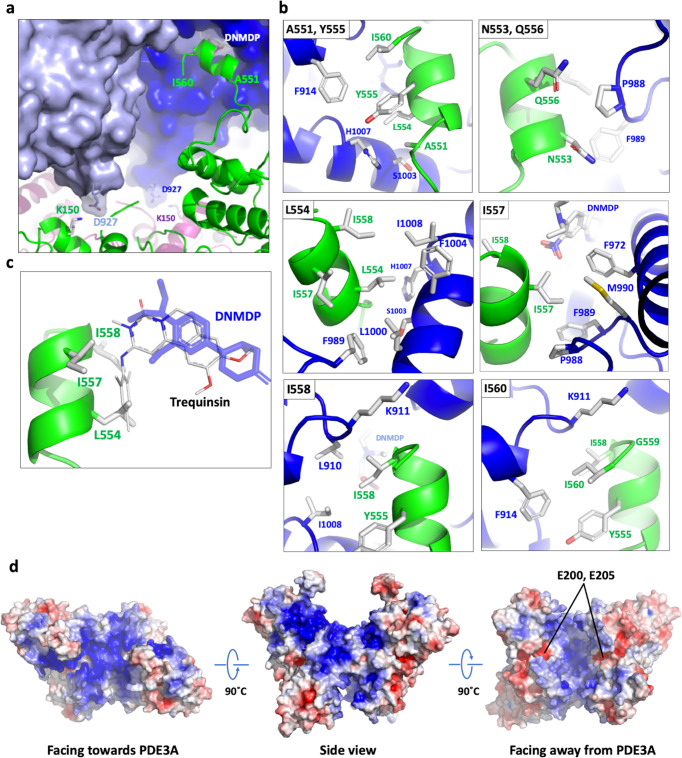
Fig. 4. Intermolecular interactions between PDE3ACAT and SLFN12.
a Summary view of intermolecular interactions between PDE3ACAT and SLFN12. The surface representation around D927 was made transparent to highlight the side chains. The residues are labeled in the color of the protein monomer they come from. b Interactions between the C-terminal region of SLFN12 and PDE3A. The SLFN12 residues that are the focus of each panel are shown in the upper left corner. The backbone and labels for the side chains of PDE3A are shown in blue and SLFN12 in green. c Modeling the effect of trequinsin on PDE3ACAT-SLFN12 complex formation. Trequinsin, shown in a thin stick format and colored per atom to differentiate from DNMDP (blue), is modeled based on superimposing the PDE3ACAT-Xtl-trequinsin structure onto PDE3ACAT in the Cryo-EM structure. d Distribution of surface charges on SLFN12. For the last figure, the location of the two putative RNAse catalytic residues on each monomer are indicated. The surface charge for the SLFN12 dimer was calculated using APBS47 and visualized in PyMOL. The surface was colored with a gradient going from blue (highly positively charged) to white (neutral), to red (highly negatively charged).

