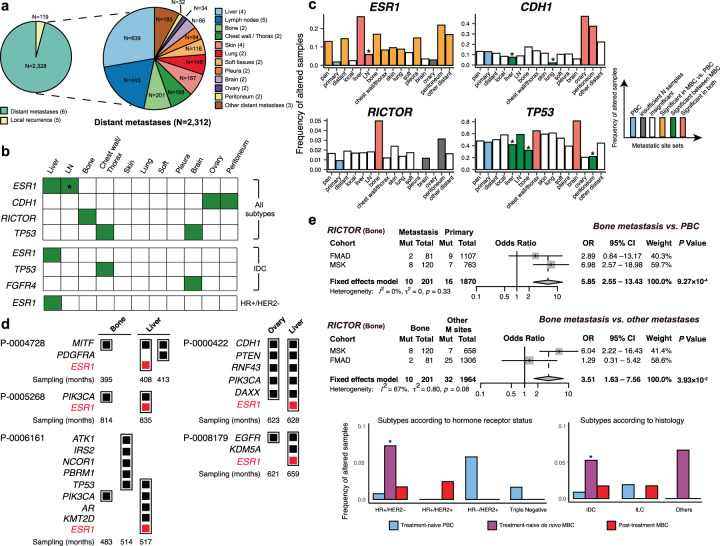
Fig. 3. Metastatic site-specific altered genes.
a Number of samples across 15 metastatic site sets (pan, local, distant, and 12 specific distant sites). In 12 specific metastatic site sets, 16 samples from the MDA cohort were excluded owing to their vague description of metastatic site (e.g., “distant organ metastasis”). The number of cohorts used in each metastatic site set is presented in parentheses. b Colored genes indicate those are more frequently altered in the corresponding metastatic site than other sites as well as MBC-enriched compared with PBC (FDR < 5%). Asterisk indicates that mutations in ESR1 are significantly less frequently altered in the lymph node than other sites while significantly enriched in MBC compared with PBC (FDR < 5%). c Distribution of mutational frequency of the four genes (SNVs/Indels) significantly altered in all MBC subtype samples across tissues. Metastatic sites with frequently altered genes compared with both other sites and PBC (FDR < 5%) are shown in red, significant genes compared with other sites in green, significant genes compared with PBC in orange, insignificant genes in white, and genes mutated in only one sample in gray. Asterisks indicate an odds ratio <1. d Preference of ESR1 mutations to the liver is represented by comparing mutations between metastatic liver samples and metastatic bone or metastatic ovarian samples from the same patients. Sampling (months) represents months between sample biopsy for sequencing and diagnosis of PBC. e Preference of RICTOR mutations to the bone is presented. Comparison of bone metastasis with PBC or other metastatic (M) sites are shown in the forest plot. P values were adjusted by FDR. Significantly frequent alterations of RICTOR are observed in de novo HR+/HER2− MBC and de novo IDC, as shown in the bottom bar graphs. Asterisks indicate statistical significance at P < 0.05.

