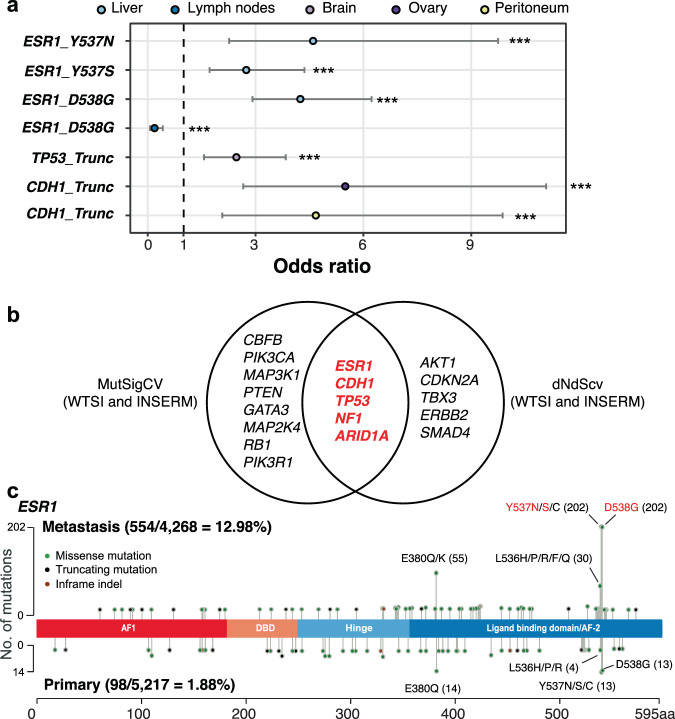
Fig. 4. Suggestive driver mutations according to metastatic sites.
a Significant MBC driver mutations across metastatic sites are shown by comparing 27 candidate driver mutations from MBC of a specific metastatic site with other metastatic sites or PBC. Presented results are from the logistic regression analysis for mutational frequency of 27 candidate driver mutations between MBC samples from different metastatic sites. Truncating mutations are represented by “Trunc” and missense mutations are shown by their amino acid change. Odds ratios and 95% CI for each mutation were shown and asterisks indicate statistical significance at FDR < 0.01. b MBC driver genes of WTSI and INSERM cohort data which had sufficient background mutations from the results of MutSigCV and dNdScv. c Mutation types of ESR1 shown in a lollipop plot. Red-colored variants are candidate driver mutations enriched in MBC samples. X-axis indicates amino acid position.

