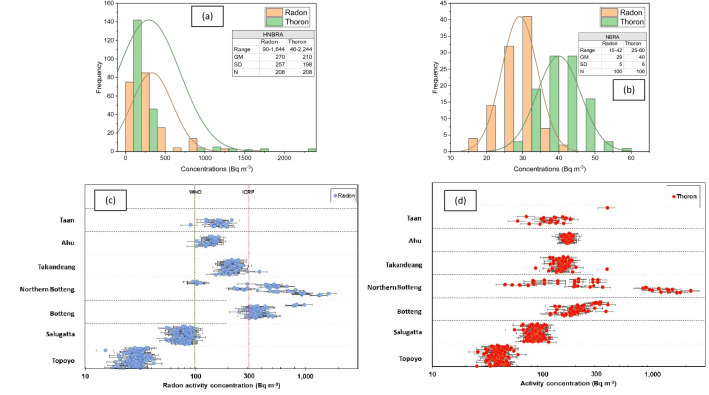
Figure 3.
Annual average radon and thoron concentrations in houses. (a) Distributions of 222Rn and 220Rn in the HNBRA. (b) Distributions of 222Rn and 220Rn in the NBRA. (c) Annual average 222Rn concentration in the study villages and control area. (d) Annual average 220Rn concentration in the study villages and control area. In (c,d) the horizontal black lines are the uncertainties. WHO26 and ICRP27 reference levels for indoor 222Rn activity concentration are 100 and 300 Bq m−3, respectively.

