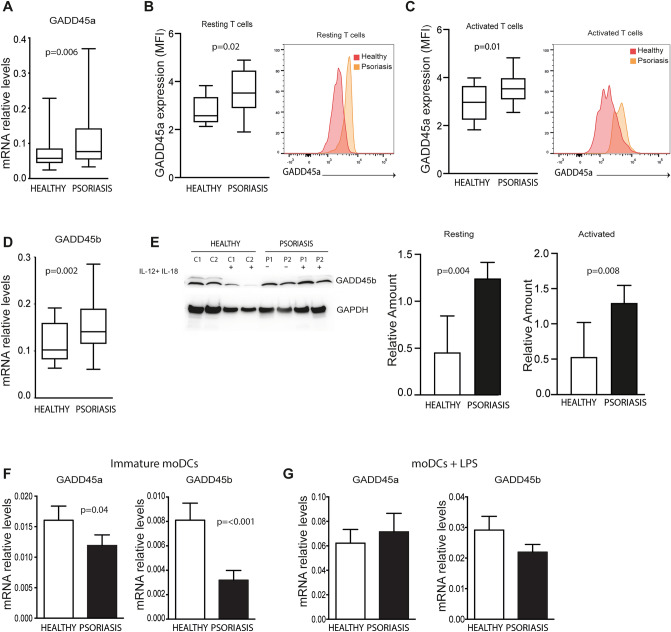
Figure 3.
Differential expression of GADD45a and GADD45b in peripheral blood leucocytes from psoriasis patients and healthy subjects. (A) Box charts show mRNA expression of GADD45a in unstimulated CD4+ T cells from psoriasis patients (n = 20) and controls subjects (n = 15). Expression was analyzed using qRT-PCR and GAPDH was used to normalize data. (B) Box charts show the expression of GADD45a in resting T cells from psoriasis patients (n = 14) and controls (n = 9). (C) Box charts show the expression of GADD45a in activated T cells from psoriasis patients (n = 14) and controls (n = 9). PBLs were incubated in the presence of anti-CD3/CD28 for 16 h, then GADD45a expression was evaluated by flow cytometry on CD3+ T cells. B-C, Data correspond to mean fluorescence intensity (MFI) of GADD45a expressed on gated CD3+ T cells. Representative histograms are shown. (D) GADD45b expression in unstimulated CD4+ T cells as in A. (E) Expression of GADD45b in total lysates of monocyte-free PBLs from psoriasis patients. Cells were incubated 24 h in the presence or absence of a mixture of IL-12 and IL18 (10 ng/ml). Representative blots from 2 out 6 patients and 2 out of 6 controls, and densitometric quantifications are shown. Bar charts show relative levels of GADD45b (data normalized to GADPDH). (F) Bar charts show GADD45a and GADD45b mRNA expression levels in immature moDCs analyzed using qRT-PCR. GAPDH was used to normalize data. (G) Expression of GADD45a and GADD45b mRNA in moDCs after 24 h of stimulation with LPS (10 ng/ml). Differences between groups were determined using Mann–Whitney U test.

