
Figure 5.
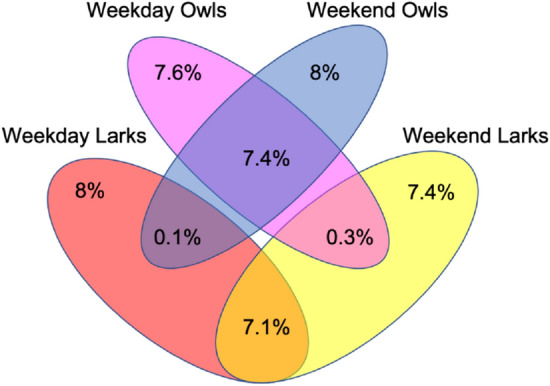
Venn diagram to show changes in larkish and owlish behaviour. The joint distribution of the larks and owls (excluding the third birds) obtained from classification of the chronotypes obtained by computing a PCA on values for weekends and for weekdays separately and presented in the form of a Venn diagram. The colours red and pink represent all the larks and all the owls on the weekdays (including extreme larks and extreme owls). The blue and yellow represent all owls and all larks on weekends (including extreme larks and extreme owls). We observe that of the population who are larks remain the same be it weekdays or weekends and similarly for of the population that are owls. A very few percentage of the population ( for larks and for owls) changes their behaviour drastically to the opposite kind depending on whether it is a weekend or weekday. We also observe that for larks and for owls on weekdays; and for larks and for owls on weekends convert to third birds in the population.