Figure 2.
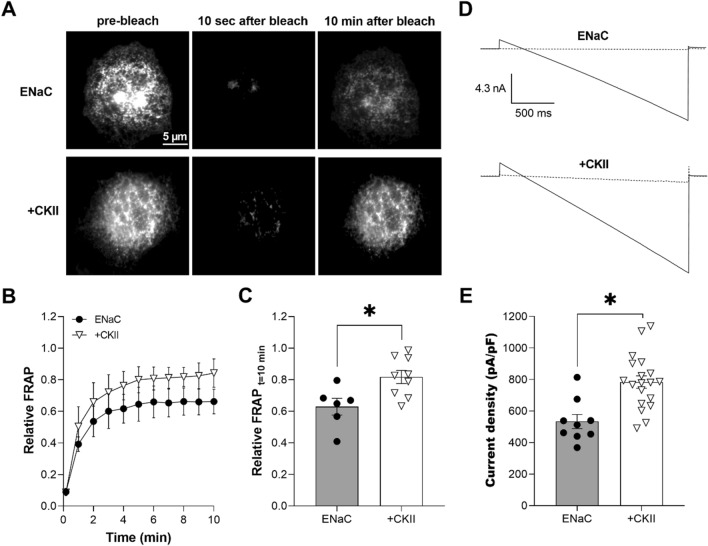
Over-expression of CKII is sufficient to increase ENaC levels in the plasma membrane and activity. (A) Fluorescence micrographs of COS-7 cells expressing eYFP-ENaC in the absence (top) and presence of over-expression of CKII (bottom) prior to photobleaching (left) and 10 s (middle) and 10 min (right) after photobleaching. Cells were transfected with eYFP-ENaC and CKII plasmids, CK2alpha and CK2beta. Images were collected with TIRF microscopy. (B) Time course of relative FRAP at the plasma membrane for cells expressing eYFP-ENaC in the absence (black circles) and presence of over-expression of CKII (white triangles). Summary data from experiments (n = 6–9 cells from 2–3 distinct transfections) identical to those shown in (A). (C) Summary graph of relative FRAP 10 min after photobleaching in cells expressing eYFP-ENaC in the absence (black circles, gray bar) and presence (white triangles, white bar) of over-expression of CKII. Summary data from experiments identical to those shown in (A). *P < 0.05 vs. the absence of CKII over-expression. (D) Overlays of typical macroscopic current traces from representative CHO cells expressing mENaC in the absence (top) and presence of over-expression of CKII (bottom) before and after 10 µM amiloride (dotted lines). Currents elicited by voltage ramps stepped from a holding potential of 40 mV to 60 mV and ramped to − 100 mV. (E) Summary graph of ENaC activity (amiloride-sensitive current density at -100 mV) quantified in whole-cell voltage clamped CHO cells transfected with mENaC in the absence (black circles, gray bar) and presence (white triangles, white bar) of over-expression of CKII. Summary data from experiments (n = 9–19 cells from 3–5 distinct transfections) identical to those shown in (D). *P < 0.05 vs. the absence of CKII over-expression.

