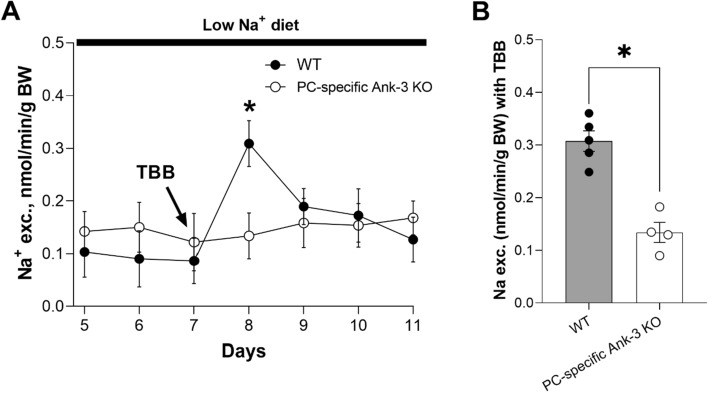
Figure 6.
Ank-3 is downstream of CKII with respect to regulation of ENaC. (A) Summary graph showing Na+ excretion as a function of time in WT mice (white circles, where n = 5 independent trials with three mice per trial) and PC-specific Ank-3 KO mice (black circles, where n = 4 independent trials with three mice per trial) before and after treatment with TBB on day 7 of a sodium free diet. TBB was introduced through a single intraperitoneal injection at 125 µg/kg in 100 µL of 10% DMSO/sterile water. Urinary sodium excretion (UNaV) was measured in 24 h intervals. *P < 0.05 vs. KO mice and before treatment. (B) Summary graph showing the effects of TBB on Na+ excretion (on day 8) in WT (black circles, gray bar) and PC-specific Ank-3 KO mice (white circles, white bar). TBB increased Na+ excretion significantly more in WT mice compared to PC-specific Ank-3 KO mice, where it had no effect. *P < 0.05 vs. KO mice.

