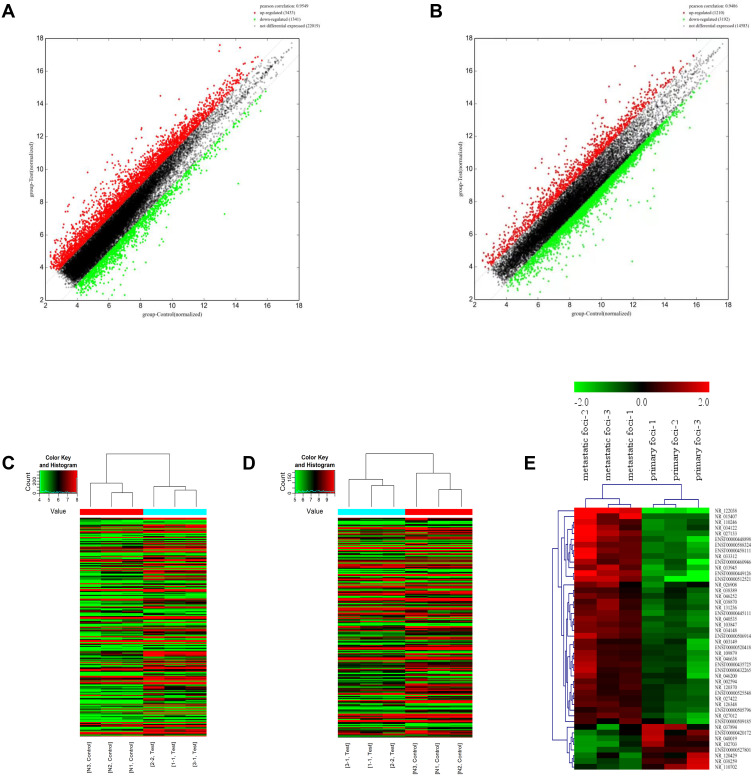
Figure 1.
The expression profile comparison of lncRNAs and mRNAs between peritoneal metastasis lesion and primary foci. (A) The lncRNAs expression variation between peritoneal metastasis lesion and primary foci. (B) The mRNAs expression variation between peritoneal metastasis lesion and primary foci. The red and green dots in (A) and (B) indicated the expression levels of lncRNAs and mRNAs with fold change >2. (C) The heat map of lncRNAs. (D) The heat map of mRNAs. (E) The heat map of lncRNAs with fold change >2. The lncRNAs were selected according to whether their biological function was known.

