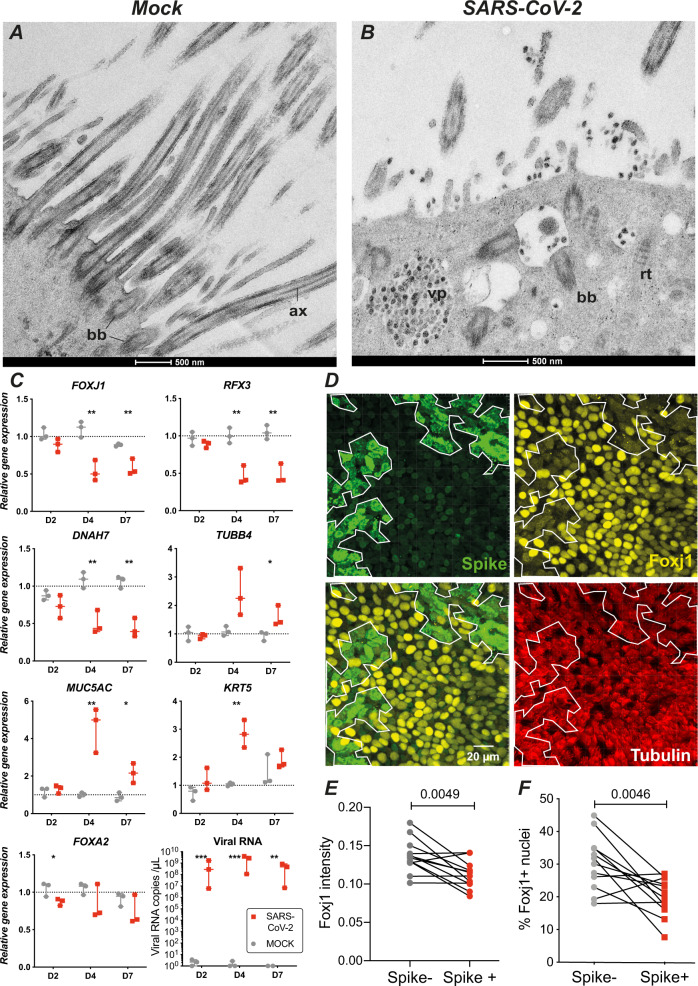
Fig. 4. SARS-CoV-2 infection perturbs ciliogenesis and induces Foxj1 downregulation.
A TEM image of a mock-infected ciliated cell with elongated axonemes (ax) and membrane proximal basal bodies (bb). B TEM image of an infected ciliated cells at 4 dpi, with viral particle (vp) accumulation, mislocalized basal bodies, and isolated rootlets (rt). lp large particle. C Quantitation of transcripts expressed in mock- and SARS-CoV-2-infected epithelia (median ± range). The expression of 8 genes was measured by qPCR in n = 3 biological replicates from different donors and compared by t-tests with false discovery rate (FDR) correction for multiple comparisons (*P < 0.05, **P < 0.01, ***P < 0.001). D Immunofluorescence analysis of epithelia at 2 dpi, after labeling for the viral spike (green), Foxj1 (yellow), and β-tubulin IV (red). The limit of the Spike+ area is reported on each panel (white line). E, F The Foxj1 mean fluorescence intensity in 3D-segmented nuclei (E) and the percentage of Foxj1+ nuclei (F) were compared in Spike− and Spike+ areas for n = 4 donors with 3 replicates per donor, using a paired t-test.

