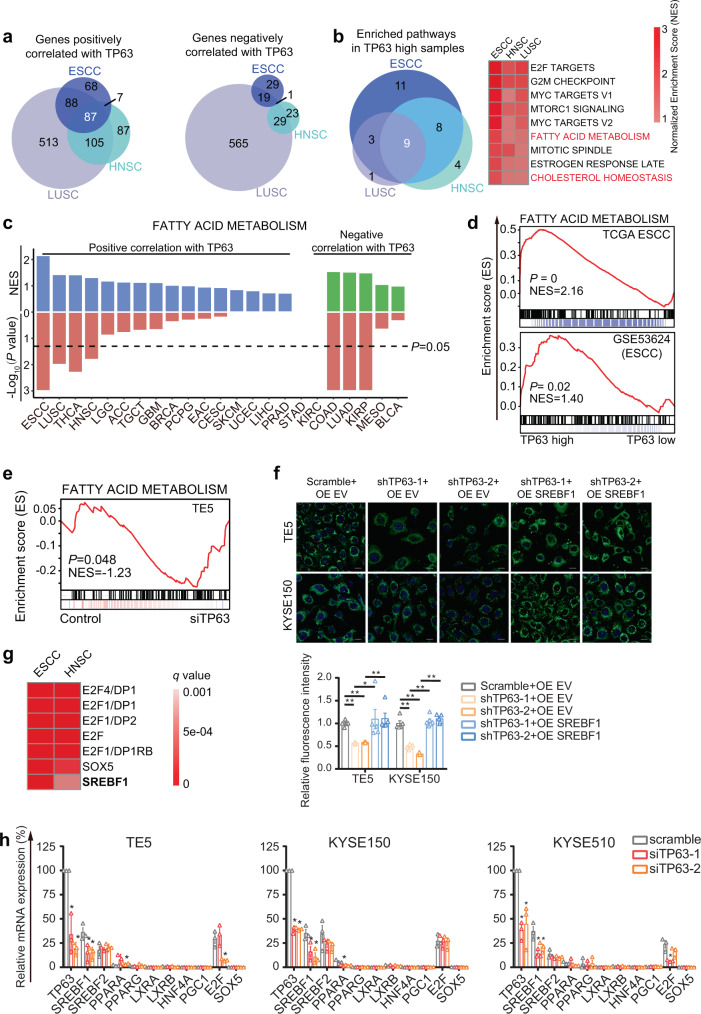
Fig. 1. TP63 regulates fatty-acid metabolism pathway through SREBF1 in SCCs.
a Venn diagrams of genes exhibiting either positive or negative correlation with TP63 across three types of SCCs (|Log2FC | >2, q-value < 0.05). b Left panel, Venn diagram of significantly enriched hallmark pathways in TP63-high SCC samples. Right panel, heatmap of GSEA results of the nine overlapped enriched pathways. c Bar plots showing the NES (normalized enrichment score, upper) and P-value (lower) from GSEA results of fatty-acid metabolism pathway in TP63-high samples from 23 types of cancers from TCGA. d Individual GSEA plots of fatty-acid metabolism pathway in two independent cohorts of ESCC samples (TCGA and GSE53624). e GSEA plot of fatty-acid metabolism pathway in RNA-Seq data upon silencing of TP63 in TE5 cells. NES normalized enrichment score. P-values in panel c–e were adjusted for multiple comparisons. f Confocal images of staining of lipid droplets after either TP63 knockdown alone or combined with full-length SREBF1 overexpression in TE5 and KYSE150 cells. Scale bar, 50 μm. Bottom panel, quantitative analysis of lipid droplet staining based on the confocal images; Mean ± SEM are shown, n = 5 except for the group of KYSE150-shTP63-1+OE SREBF1 (n = 6), as the number of microscopic vision. *P < 0.05; **P < 0.01; P-values were determined by a two-sided t-test. g Heatmap showing the enriched motifs (q value < 0.001) in promoter regions of genes positively correlated with TP63. h Relative mRNA levels of indicated regulators of fatty-acid metabolism following siRNA knockdown of TP63 in TE5, KYSE150, and KYSE510 cells. Mean ± SEM are shown, n = 3 (biological replicates). *P < 0.05; P-values were determined by a two-sided t-test.

