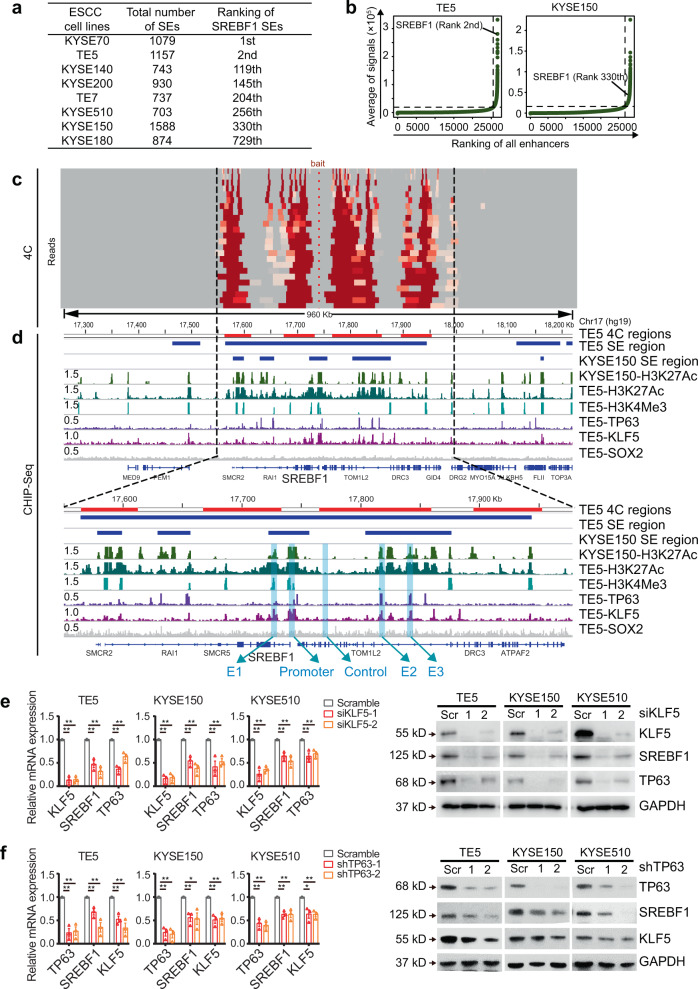
Fig. 2. TP63 and KLF5 co-regulate SREBF1 in ESCC cells.
a Ranking of SREBF1 super-enhancers (SEs) in eight ESCC cell lines. b Inflection plots ranking all typical- and super-enhancers in TE5 and KYSE150 cells. c 4C assay showing the long-range interactions anchored on SREBF1 promoter in TE5 cells. Deeper red color indicates higher interaction frequency. d IGV plots showing ChIP-Seq profiles of indicated factors in SREBF1 gene locus. Blue shadows highlighting selected constitutive enhancers (E1, E2, and E3), promoter and one negative control (Control) region. 4C-postive regions are depicted as red bars and super-enhancer (SE) regions are depicted as blue bars on top of the IGV plots. RPM (Reads per million mapped reads) values of peaks are on the left of the tracks. e, f qRT-PCR and western blotting assays upon knockdown of either e KLF5 or f TP63 in ESCC cells. Mean ± SEM are shown, n = 3 (biological replicates). *P < 0.05; **P < 0.01; P-values were determined by a two-sided t-test. Full-length SREBF1 is shown.

