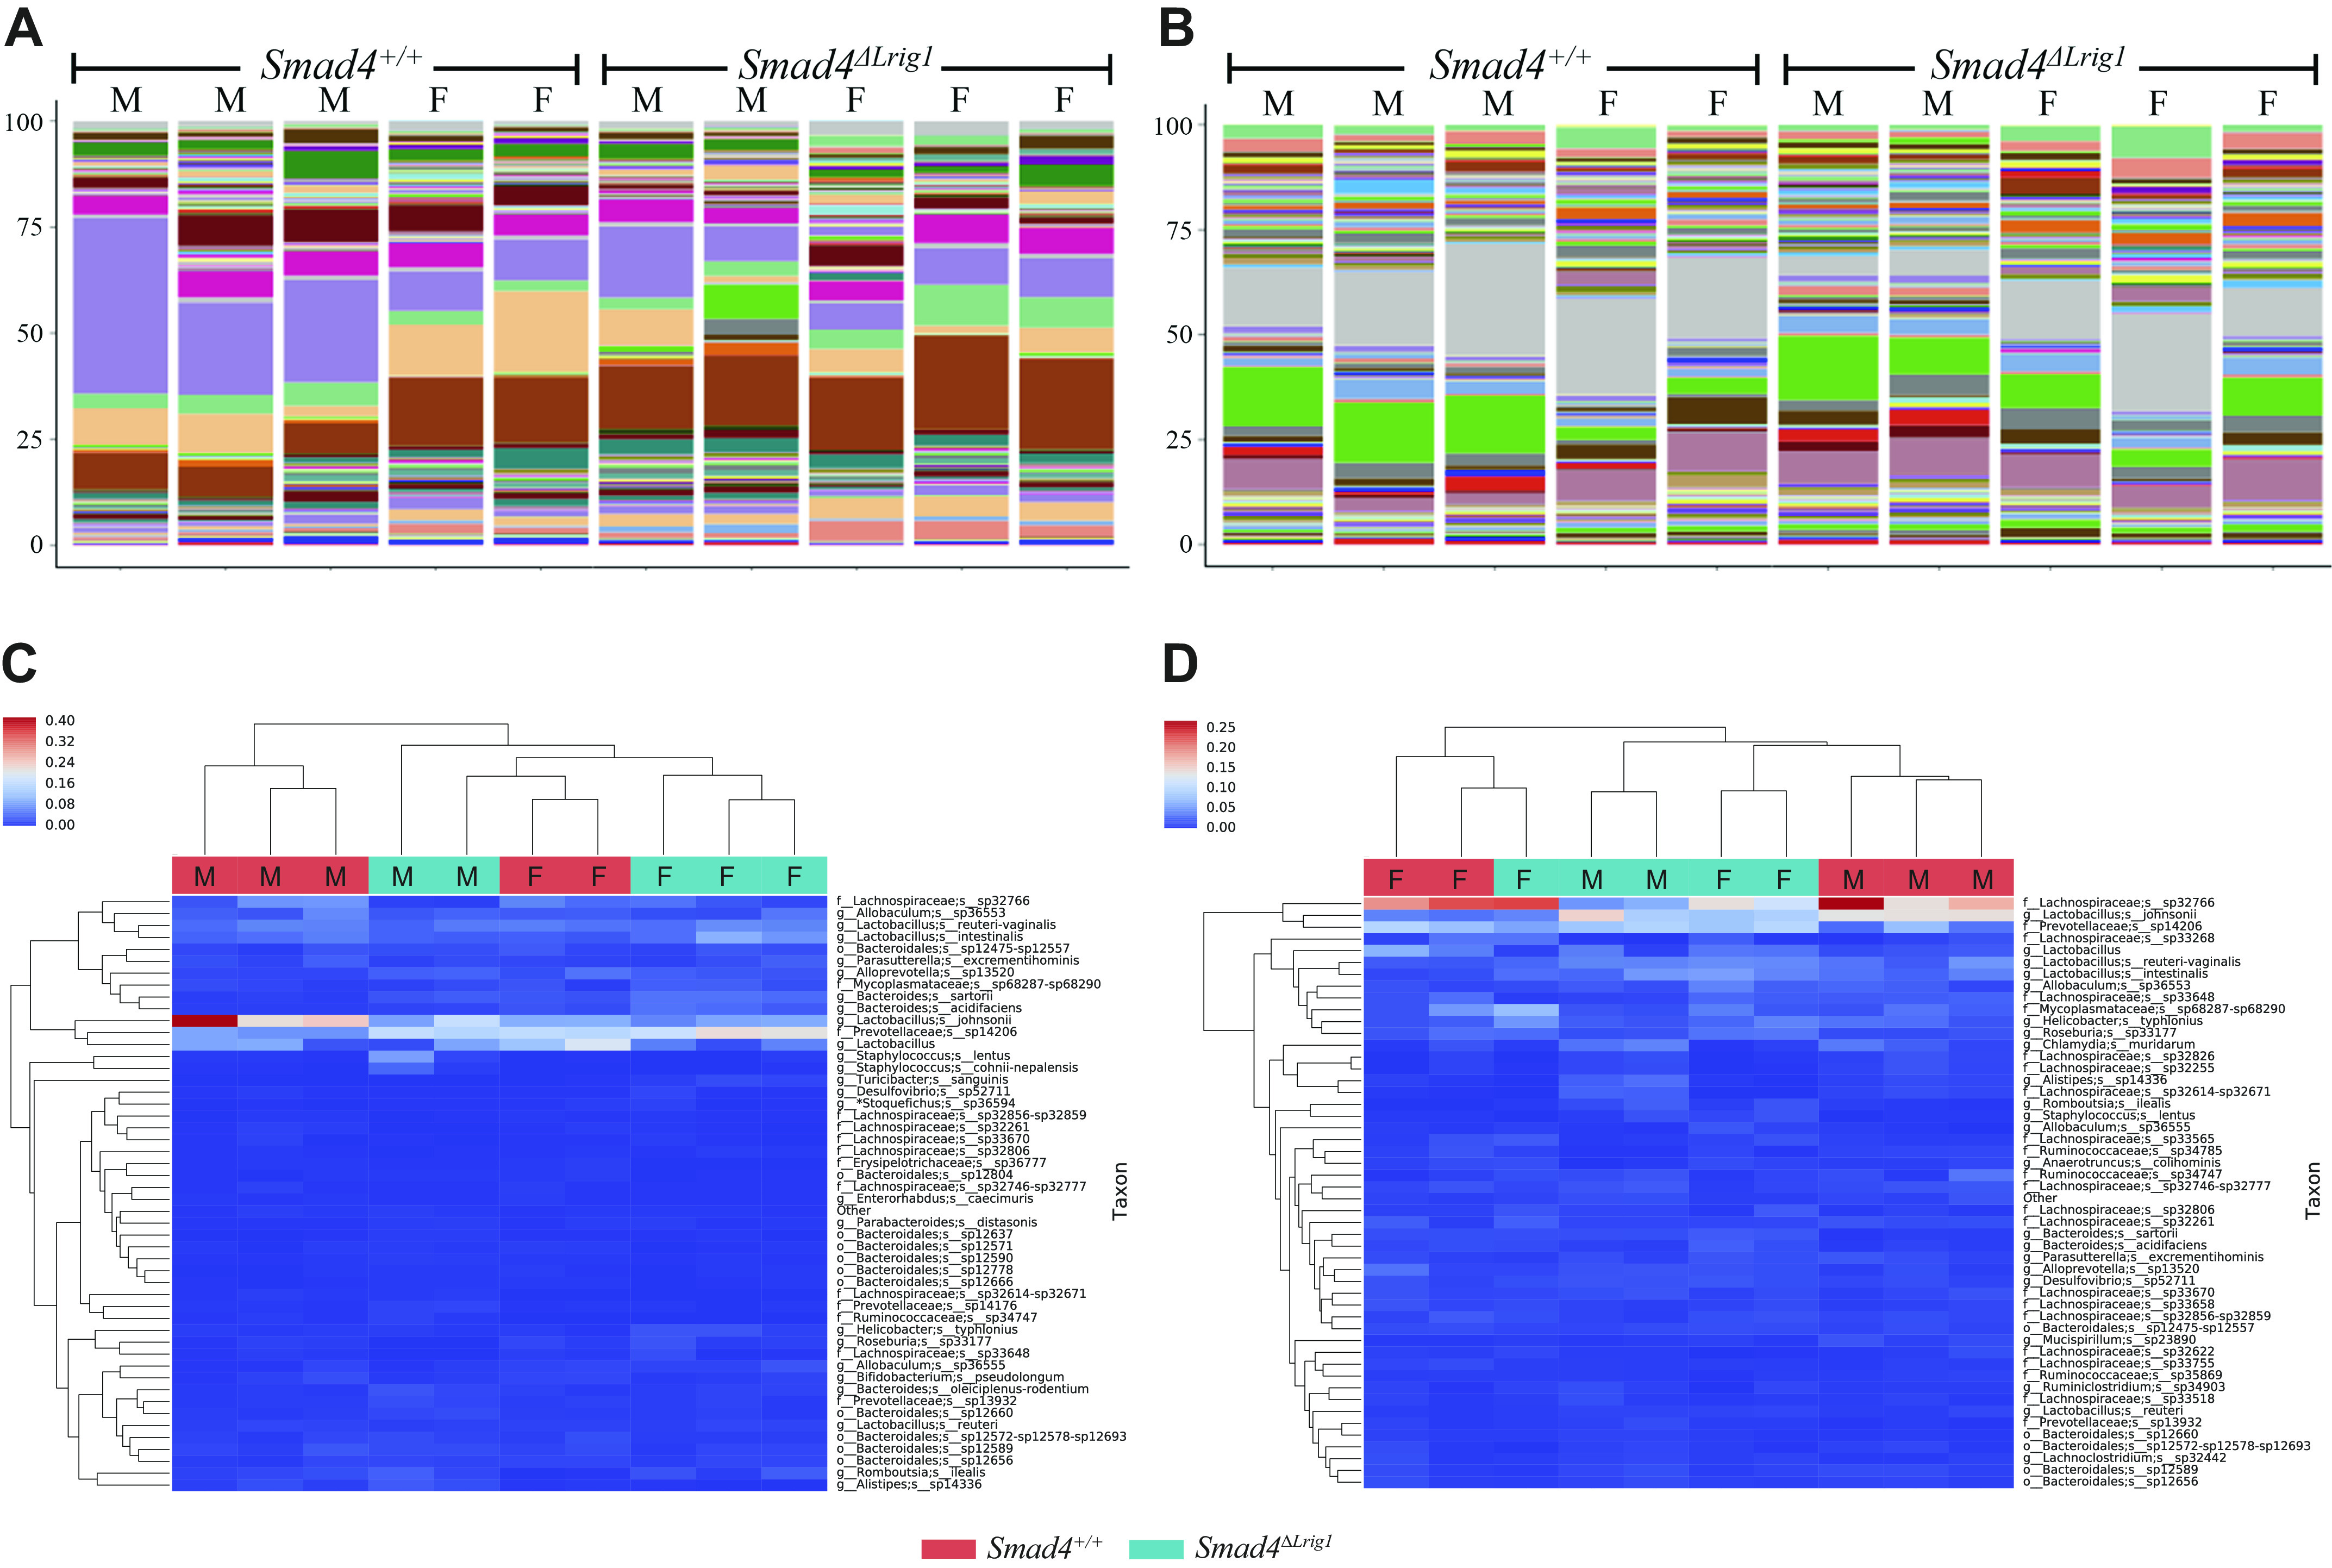
Figure 3.

Colonic microbiome composition in five Smad4ΔLrig1 and five control mice. Composition bar plots from stool pellets (A) and colon mucosal scrapings (B) of five Smad4ΔLrig1 and five control mice. Each color represents a unique bacterial species. Heatmaps with unsupervised hierarchical clustering of stool pellets (C) and colon mucosal scrapings (D) from five Smad4ΔLrig1 and five control mice. All mice were littermates. “F” indicates female mice who were housed together, and “M” indicates male mice who were housed together (bedding mixed between the one male and one female cage weekly).
