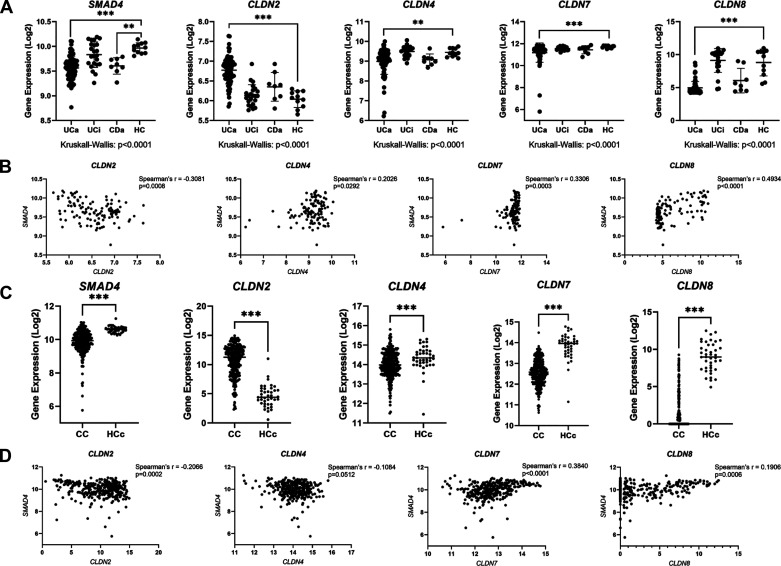
Figure 8.
SMAD4 and CLDN genes are dysregulated in human inflammatory bowel disease (IBD) and colon cancer. A: in silico analysis of human microarray database (accession number GSE75214). Samples represent human colon biopsy samples from patients with active ulcerative colitis (UCa, n = 74), inactive ulcerative colitis (UCi, n = 23), active Crohn’s disease (CDa, n = 8), and healthy controls (HC, n = 11). Gene expression in human biopsy samples were compared between groups using the nonparametric Kruskal–Wallis test with post hoc Welch’s t test. B: correlation between SMAD4 expression and indicated CLDN gene expression in human colon biopsy specimens from GSE75214. Spearman’s correlation was used to measure correlation between SMAD4 and CLDN gene expression. C: in silico analysis of RNA-sequencing data from The Cancer Genome Atlas (TCGA) database. Samples represent mRNA expression in colon cancer (CC, n = 283) or healthy control colon (HCc, n = 41) specimens. Nonparametric Mann–Whitney test was used to compare gene expression levels between groups. D: correlation between SMAD4 expression and indicated CLDN gene expression in human colon specimens from TCGA. Spearman’s correlation was used to measure correlation between SMAD4 and CLDN gene expression. For A–D, gene expression levels are represented on a Log2 scale. Statistical significance is designated as **P < 0.01, ***P < 0.001.

