Figure 3.
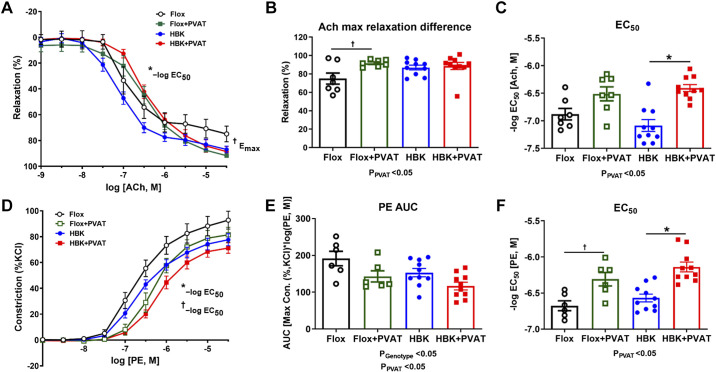
PVAT-dependent endothelial function is altered in HBK mice. Vascular reactivity studies in the thoracic aorta of HBK and flox mice were assessed with acetylcholine (ACh)-induced vasorelaxation in the absence and presence of PVAT (A), Emax in the absence and presence of PVAT in flox and HBK mice (B), ACh EC50 in the absence and presence of PVAT in flox and HBK mice (C), phenylephrine (PE)-induced vasoconstriction curves in the absence and presence of PVAT (D), PE-induced responses assessed by AUC in flox and HBK mice in the presence and absence of PVAT (E), and PE EC50 in the absence and presence of PVAT in flox and HBK mice (F). Sensitivity (−log EC50) and maximal effect (Emax) were determined in response to agonists. Two-way ANOVA was used to compare effects of PVAT and genotype with Tukey’s post hoc test (n = 6 or 12, *P < 0.05). Refer to Table 4 for values of ACh, SNP, PE, and KCl curves and statistical analysis. Significant two-way ANOVA results are included in graphs. PVAT had a significant effect on ACh Emax (A and B), ACh EC50 (A and C), PE AUC (E), and PE EC50 (D and F). There was a significant effect of genotype on PE AUC (E). Symbols indicate statistically significant differences (P < 0.05) for post hoc tests showing differences within genotypes with (+) and without (−)PVAT. †P < 0.05 Flox + PVAT vs. Flox; *P < 0.05 HBK + PVAT vs. HBK. AUC, area under the curve; HBK, hepatocyte-specific Bmal1 knockout; PE, phenylephrine; PVAT, perivascular adipose tissue; SNP, sodium nitroprusside.

