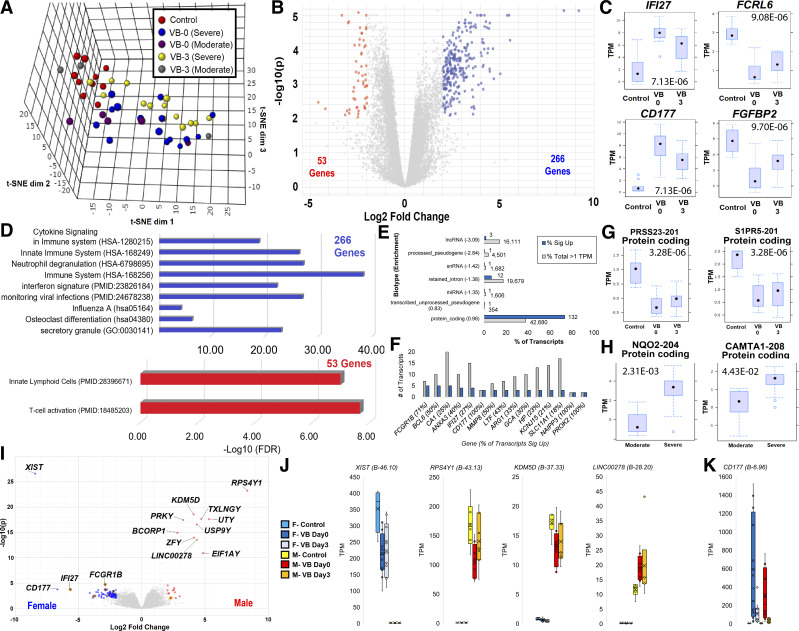
Figure. 2.
Transcriptome comparisons of viral bronchiolitis (VB) day 0 and 3 versus controls. A: sample segregation for all control (red), VB day 0 severe (blue), VB day 0 moderate (magenta), VB day 3 severe (yellow), and VB day 3 moderate (gray) transcriptomes for gene expression on three-dimensional reduction using t-SNE. B: volcano plot of genes with differential expression between nested control versus VB day 0 relative to VB day 0 versus VB day 3 for genes higher (blue) or lower (red). Cutoffs used were log2 fold change 2 and Adj-P < 0.01, with 319 identified genes. C: top four significant genes up or down shown as box and whisker plots with Adj-P value shown. D: STRING-based enriched pathways for genes higher (blue) or lower (red) in VB. Values are shown as the −log10 of P value and the term identification number is in parentheses. E: top segregating transcripts between controls and VB day 0 (blue) annotated at biotype level. The gray box shows the percent of mapped transcripts for each biotype and the blue box shows the percent of genes significantly different with log2 fold change 2 and Adj-P < 0.01. F: transcripts with multiple isoforms significant between controls and VB. The gray box shows the total number of mapped transcripts and the blue box shows how many were significantly changed. The percent of transcripts change for each gene is labeled in parentheses. G: each transcript is labeled with ENST, protein name in parenthesis, and biotype annotation with values shown as box and whisker plots. F: volcano plot of male control versus male day 0 relative to male day 0 versus female day 0. The top genes based on combined B metric are labeled. G and H: top two significant transcripts between controls and VB samples (G) or moderate versus severe VB (H) shown as a box and whisker plot. I: volcano plot for nested comparison of control versus VB relative to male versus female. J: top four genes for nested comparisons. Colors represent samples: cyan-F control, dark blue-F severe VB, light blue-F moderate VB, gray-M control, red-M severe VB, orange-M moderate VB. K: female versus male values for the highly significant CD177 using same colors as panel J. TPM, transcripts per million.

