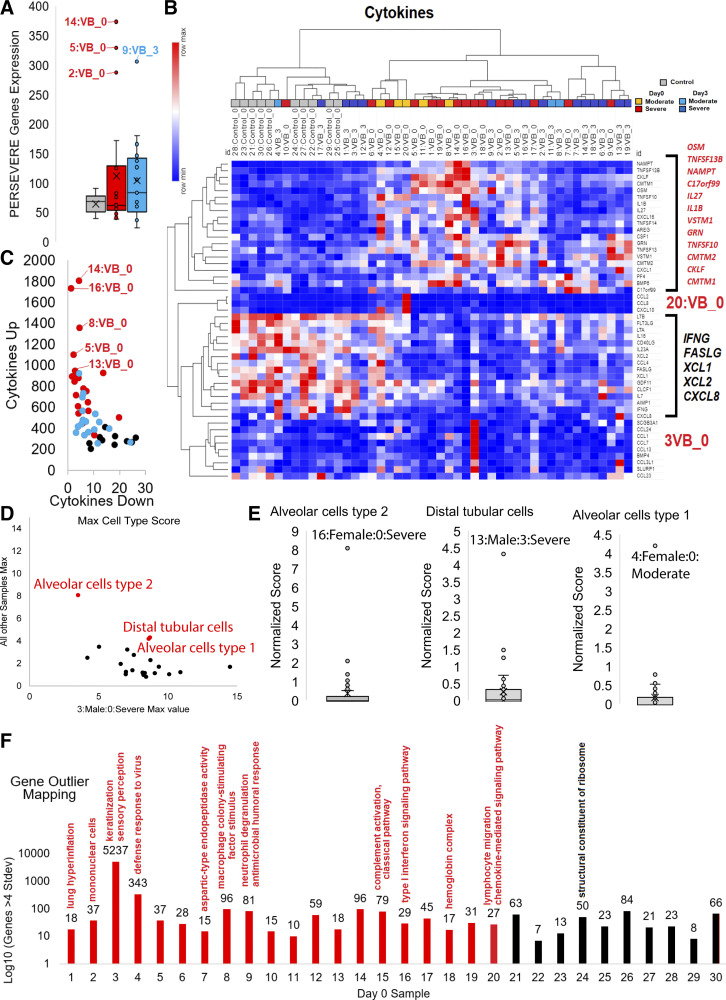
Figure. 4.
Gene outlier mapping for samples. A: expression levels of the top five severity genes for PERSEVERE scores for controls (gray), VB day 0 (red) and VB day 3 (cyan) with outliers labeled. B: top cytokines expressed in samples shown as a heat map (red is highest value of each cytokine and blue the lowest). Clustering of samples was performed using one minus Pearson’s correlation. To the right are the top significant cytokines segregating controls versus VB day 0 samples that are higher (red) or lower (black) in VB day 0. C: additive cytokines from panel B for each sample that are down (x-axis) or up (y-axis) in VB day 0 samples. The highest expression of elevated factors are labeled. D: annotated of the normalized mapping value for cell-type-specific genes in patient 3 time point 0 relative to the max value of all other samples. The top three non patient 3 mapping values are labeled in red. E: outlier mapping for the top three in panel D, labeling the patient with highest mapping levels. F: genes significantly elevated (4 standard deviations above others) in each of the day 0 VB (red) or control (black) samples. Labeled above, each are GO enrichment terms identified from the sample elevated genes. VB, viral bronchiolitis.

